DORA metrics celebrate deployment frequency but mask massive rework rates. Here is the AI Attribution layer engineering leaders need to audit real impact.
- The Velocity Illusion: Why DORA Breaks under Agentic AI
- The Core Limits of Classical DORA Metrics
- Introducing the AI Attribution Layer
- attributing Code Provenance: git Telemetry Architecture
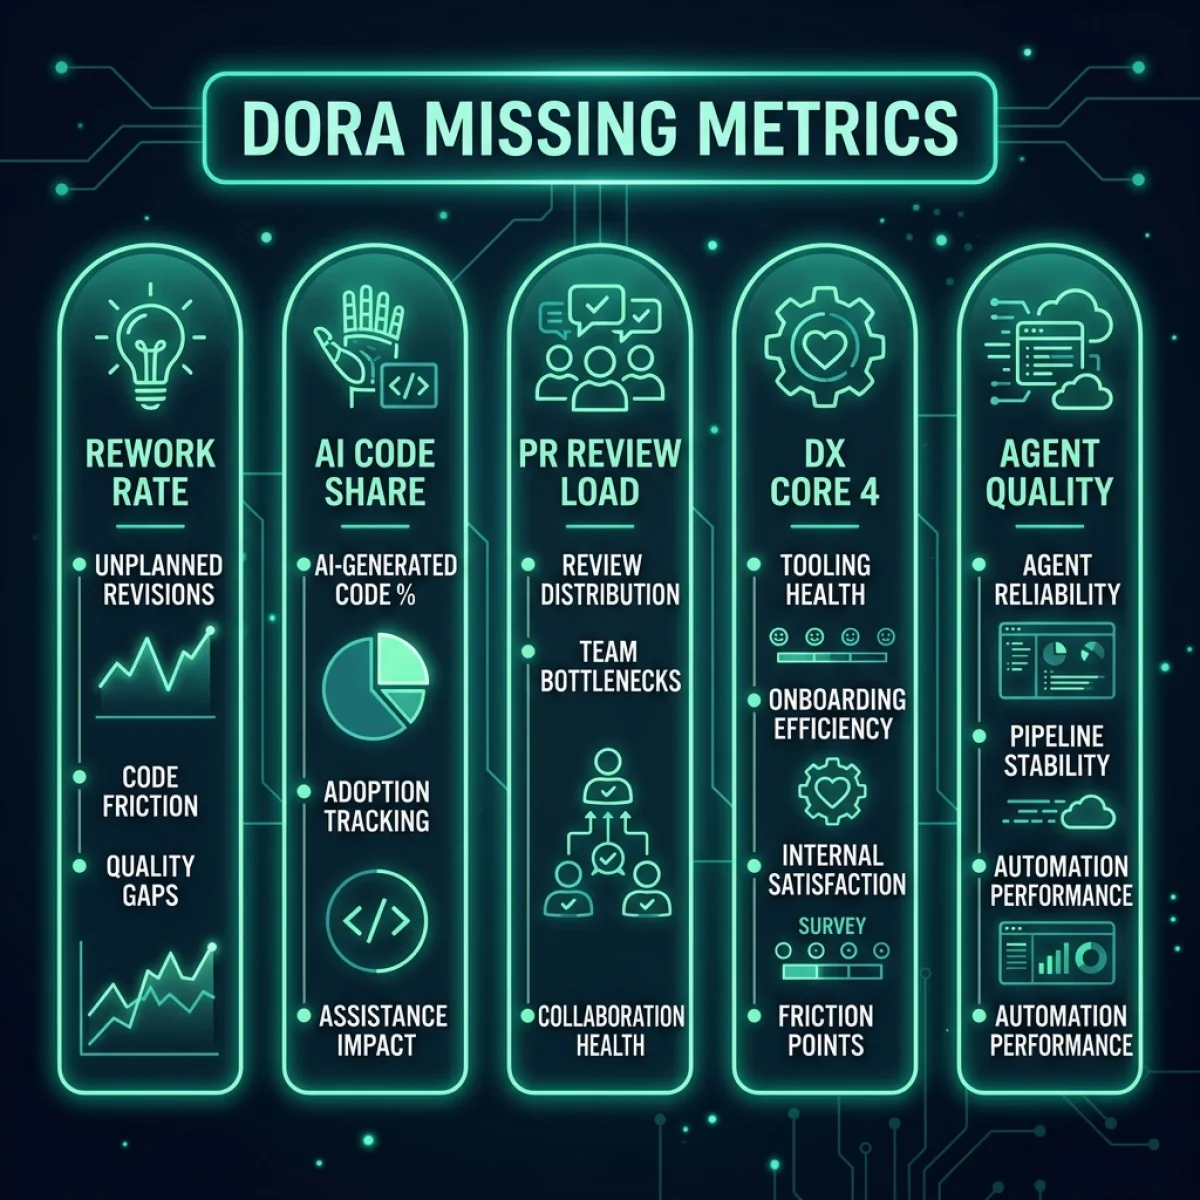
- The Five Missing Metrics of the Agentic Era
- Metric Selection: Executive, Platform, and Product Frameworks
- The 2027–2030 Transition Roadmap: From Human-Only to Hybrid Engineering
- Vatsal Shah's Executive Playbook & Practitioner Recommendations
- Frequently Asked Questions (FAQ)
- References & Authoritative Sources
For nearly a decade, the DevOps Research and Assessment (DORA) metrics have served as the undisputed gold standard for measuring software delivery performance. By evaluating organizations across four key dimensions—Deployment Frequency (DF), Lead Time for Changes (LT), Change Failure Rate (CFR), and Time to Restore Service (MTTR)—engineering leaders possessed a standardized, highly reliable framework to gauge their operational health. High-performing teams deployed frequently, kept lead times under a day, maintained low failure rates, and recovered from incidents within minutes.
However, the rapid infiltration of generative AI autocomplete assistants and autonomous coding agents in late 2024 through 2026 has introduced a fundamental disruption. The relationship between human effort, code volume, and delivery speed has been permanently severed. Today, an engineering organization can show a 40% increase in deployment frequency and a 60% reduction in lead times, yet suffer from declining system stability, massive code churn, and severe developer burnout.
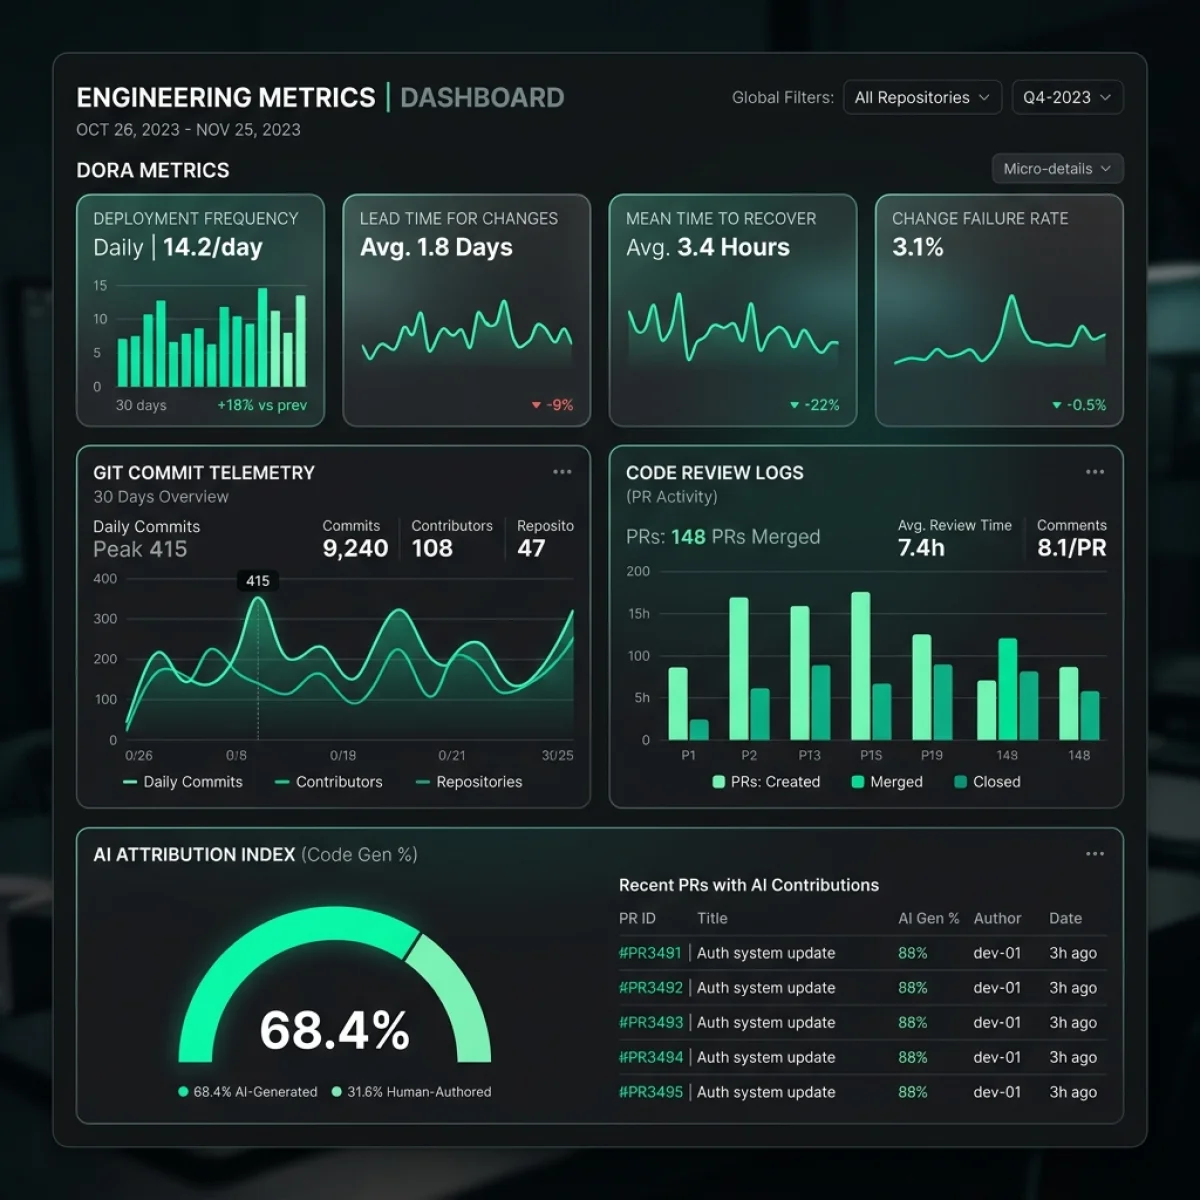
This paradox is what I call the Velocity Illusion. Classical DORA metrics measure the mechanics of code delivery—how often a pipeline runs and how fast a change travels from commit to production—but they fail to measure the integrity of the content being delivered. When an AI agent can generate 1,000 lines of code in seconds, spin up 15 pull requests in an hour, and execute self-healing hotfixes, it bloats the telemetry. The deployment frequency goes through the roof, and the lead time shrinks to minutes.
Yet, behind this beautiful dashboard lies a dirty secret: much of that code is unstable, suffering from high "rework rates" where code written on Monday is completely replaced or rewritten by Friday because of logical edge-case failures. Human developers find themselves trapped in a secondary bottleneck—reviewing massive, auto-generated PRs, leading to cognitive fatigue and a severe slowdown in architectural oversight.
To make sense of this new landscape, engineering leaders must move beyond simple DORA metrics. They require a dedicated AI Attribution Layer—a metrics framework that separates human contributions from machine actions, audits the quality and longevity of AI-generated assets, and measures the true cognitive load imposed on the organization.
Let us inspect the conceptual architecture of this hybrid measurement landscape:
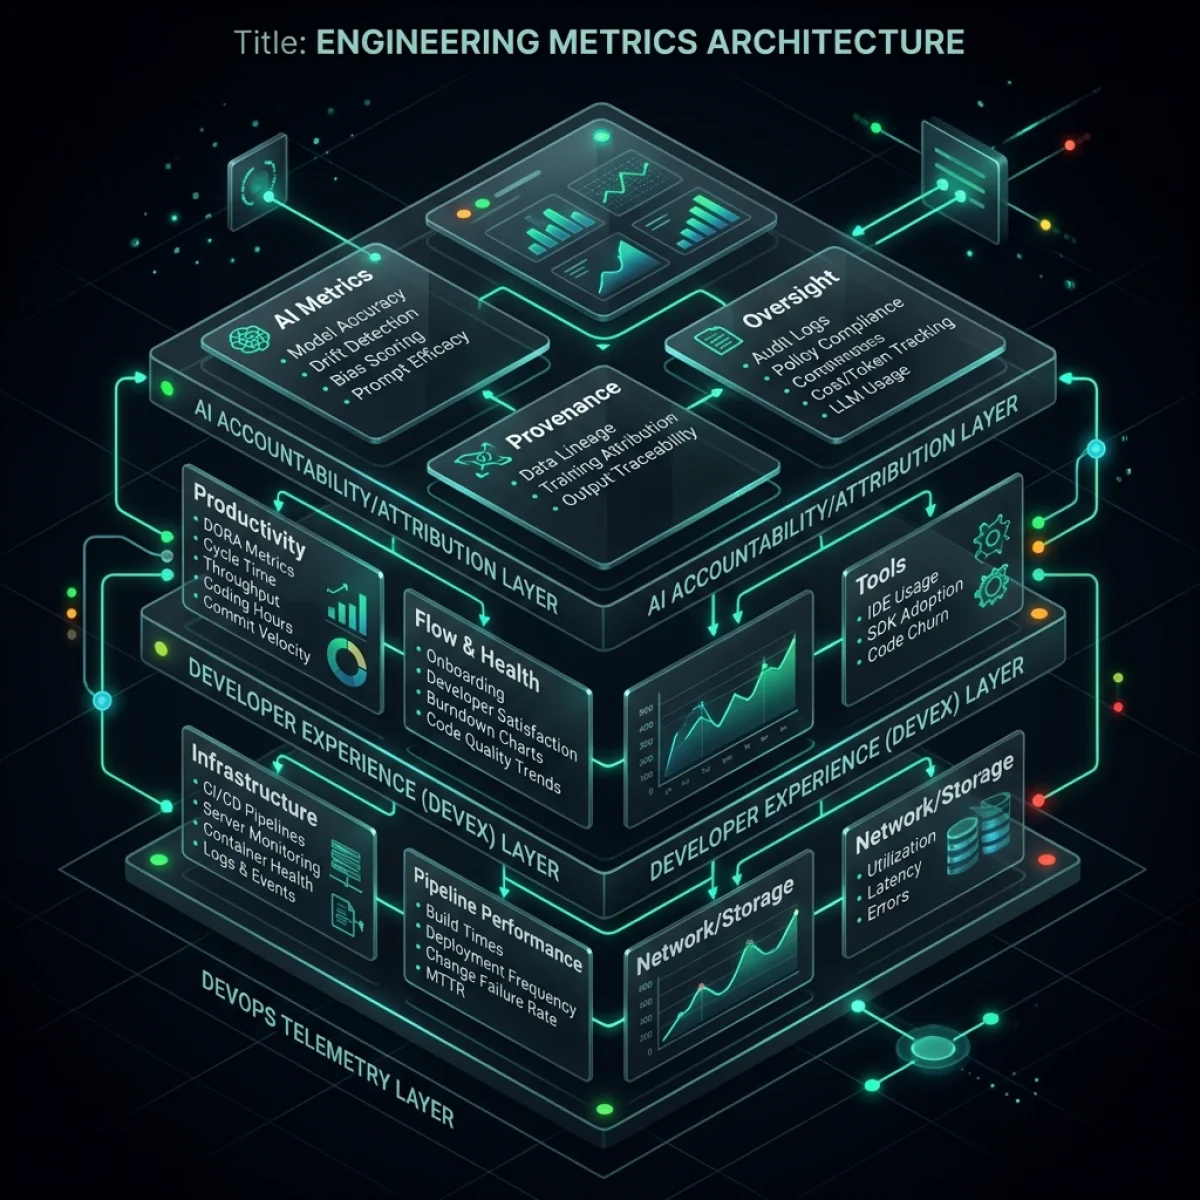
To understand why DORA is failing, we must analyze how generative AI and autonomous agent workflows manipulate each of the four DORA components.
1. Deployment Frequency (DF)
In a traditional human-centric engineering environment, deployment frequency is a proxy for batch size. To increase DF, teams must break down large features into small, low-risk releases. This is an excellent operational practice.In the agentic era, however, deployment frequency simply reflects the speed of the model's generation loops. An autonomous agent tasked with fixing an API endpoint might generate a PR, trigger a CI failure, write a new commit, and redeploy. If the agent operates on a continuous feedback loop, it can trigger dozens of deployments per day. This creates the illusion of an elite team, but in reality, it is a single agent iteratively debugging in production or staging environments. The metric has been gamified, not by intent, but by the natural velocity of programmatic loops.
2. Lead Time for Changes (LT)
Lead time measures the duration from a commit being registered to that commit running in production. When developers use AI tools to draft functions, write tests, or generate boilerplate code, the time spent drafting the code decreases. The commit is created faster, and the automated merge gates process it.However, this ignores the queue time. While the active coding time drops, the idle time in the PR queue spikes. Human reviewers cannot keep pace with the volume of code being proposed. Therefore, the commit-to-deploy duration might appear low on automated runs, but the time from initial feature concept to actual business value delivery is frequently delayed due to human blockages in the approval pipeline.
3. Change Failure Rate (CFR)
Traditionally, CFR is the percentage of deployments that cause a failure in production. In the hybrid developer era, CFR is heavily distorted by two factors:- Agent Self-Healing: Some advanced agent platforms detect production regressions and automatically trigger rollback or quick-fix deployments. If a deployment fails and is fixed by an agent in three minutes, does it count as a failure? Under classical tracking, yes, but it is often ignored or categorized differently, hiding underlying code fragility.
- Micro-Commit Spam: The sheer volume of micro-deployments dilutes the failure ratio. If a team deploys 100 times a day (mostly tiny, agent-generated cleanups) and has 5 failures, their CFR is a stellar 5%. If they deployed 10 times a day (larger, human-reviewed blocks) and had 1 failure, their CFR would be 10%. The agentic volume masks the true instability of the core application.
4. Time to Restore Service (MTTR)
Like lead time, MTTR is heavily skewed by automated recovery tools. When an anomaly is detected, an agent can restore a service by rolling back a commit instantly. While this drives MTTR down to near-zero, it does not solve the root cause. The system is stable, but the feature pipeline is blocked because the broken code has been returned to the backlog. The team spends days debugging why the agent's code failed, yet the MTTR dashboard proudly displays "Elite" status.To illustrate these differences, consider this comparison grid between classical DORA and the AI Attribution Layer:
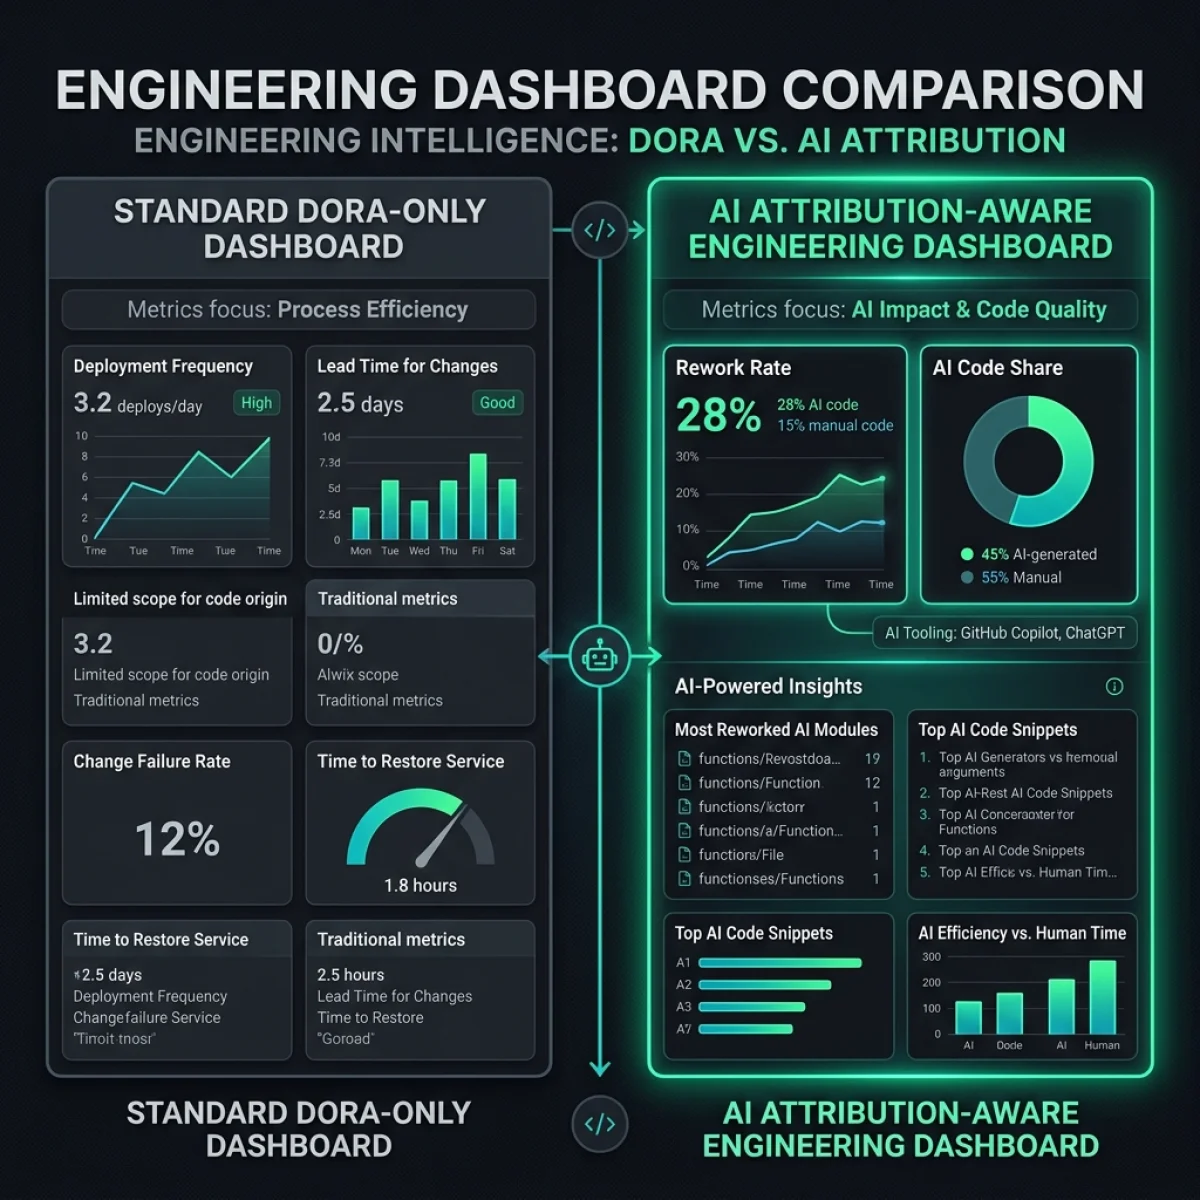
Introducing the AI Attribution Layer
The solution to these distortions is not to abandon DORA, but to implement a telemetry framework that attributes every code modification, deployment action, and system change to its source—whether human, machine, or a hybrid collaboration. This is the AI Attribution Layer.
This layer is built on the premise of Code Provenance. Provenance tracking requires that every line of code committed to a repository, every test execution, and every deployment trigger carry metadata indicating:
- The Originator: The entity that generated the initial text/logic (e.g., a specific developer, an inline autocomplete tool, or an autonomous agent).
- The Editor: The entity that reviewed, modified, or approved the change before commit.
- The Context: The prompt, model version, and user intent that triggered the generation.
Furthermore, this layer introduces the concept of the Rework Window. If an agent writes a module, and a human developer has to modify or rewrite 60% of that module within 14 days, the AI attribution layer registers a high rework rate for that specific agent run. This directly offsets the "velocity" score of that model, providing a realistic measure of code quality and true productivity gains.
Attributing Code Provenance: Git Telemetry Architecture
To implement code provenance tracking, the engineering organization must deploy specialized telemetry collection agents at key touchpoints: the local IDE, the git hosting provider (GitHub/GitLab), and the CI/CD pipeline.
Here is the flow of data through the attribution system:
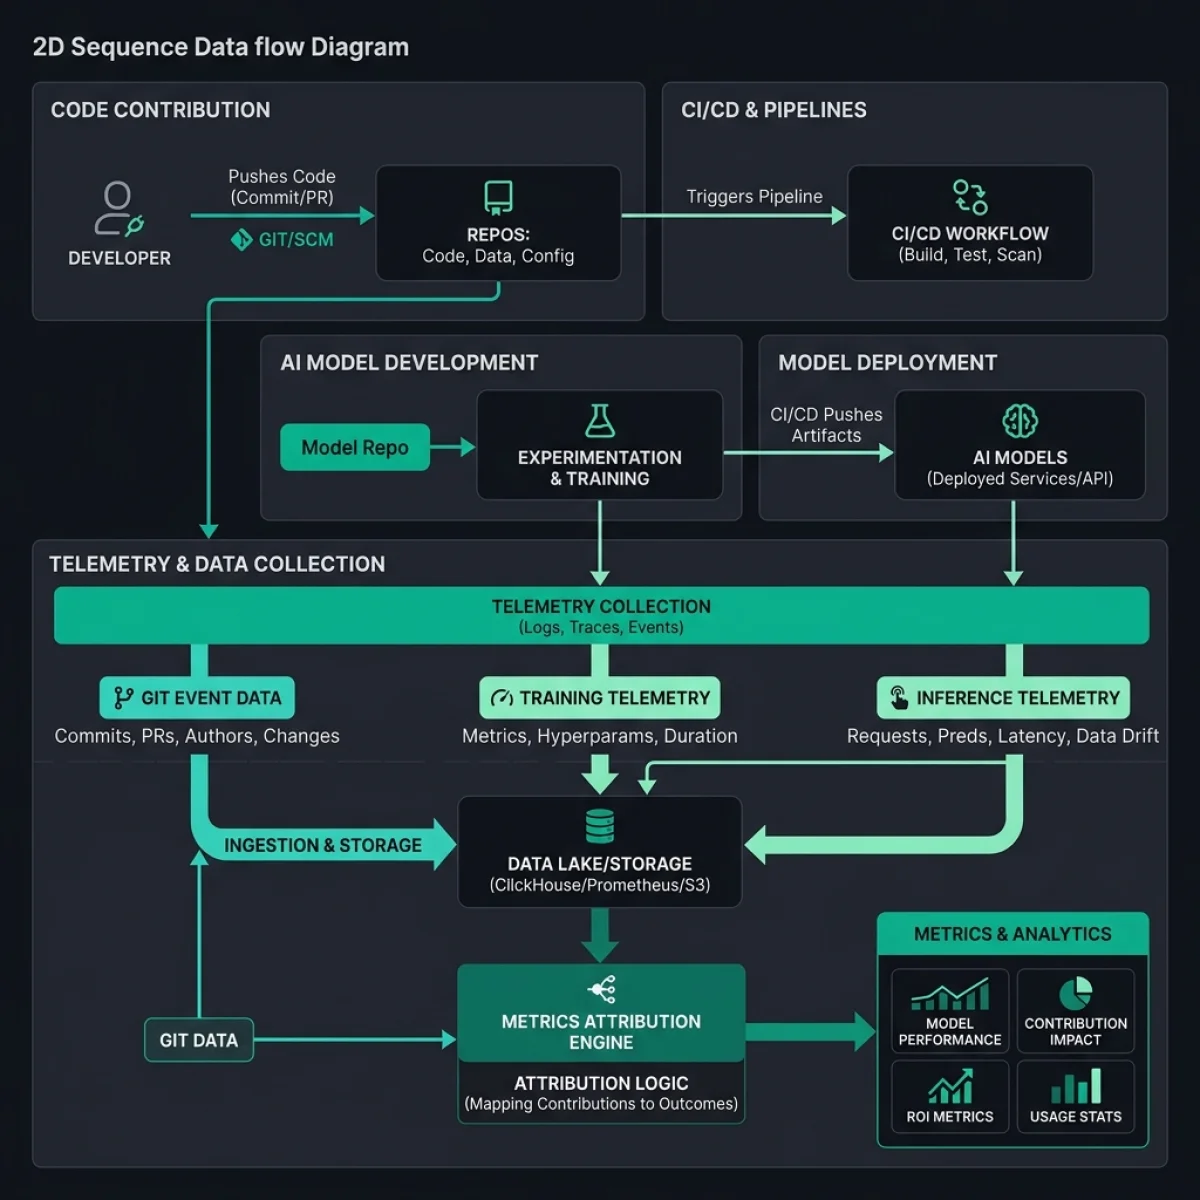
Telemetry Collection Flow
- IDE Instrumentation: When a developer uses an autocomplete tool or an inline agent, the editor extension captures the generated character block, the trigger time, and the active model identifier.
- Metadata Injection: The extension writes this metadata to a local git trailer format (e.g.,
Co-authored-by: AI-Agent) or stamps it into a hidden commit metadata file. - Commit Signature: The commit is signed using a developer's GPG key, verifying that a human reviewed the change, or signed by the agent service account if executed autonomously.
- CI/CD Telemetry Parser: During the build phase, a custom parser reads the git commit trailers, maps the code diffs, and computes the exact "AI Code Share" percentage for each file changed.
- Data Warehouse Ingestion: The parsed data is sent to a central telemetry storage (e.g., ClickHouse or PostgreSQL) where it is aggregated with production DORA logs.
Implementing a Provenance-Aware Git Hook
To ensure every commit is stamped with author attribution metadata, platform teams can deploy a standardized prepare-commit-msg hook across all developer machines. This hook intercepts commit message creation and appends metadata if an AI tool was active during the coding session.
Here is an implementation of a Python-based Git hook that scans for local workspace editor telemetry and appends metadata trailers to the commit message:
#!/usr/bin/env python3
import os
import sys
import json

def main():
    commit_msg_filepath = sys.argv[1]

    # Path to local workspace telemetry generated by the IDE extension
    telemetry_file = os.path.join(os.getcwd(), ".git", "atg_telemetry.json")

    metadata_trailers = []
    if os.path.exists(telemetry_file):
        try:
            with open(telemetry_file, "r") as f:
                data = json.load(f)
                model_used = data.get("active_model", "unknown-model")
                code_share = data.get("ai_code_share_pct", 0)

                # Format standard git trailers
                metadata_trailers.append(f"AI-Model-Attribution: {model_used}")
                metadata_trailers.append(f"AI-Code-Share-Estimate: {code_share}%")
        except Exception as e:
            sys.stderr.write(f"Warning: Failed to parse telemetry file: {e}\n")

    if metadata_trailers:
        with open(commit_msg_filepath, "r+") as f:
            content = f.read()
            f.seek(0, 0)

            # Append trailers to the end of the commit message
            separator = "\n" if not content.endswith("\n") else ""
            f.write(content + separator + "\n" + "\n".join(metadata_trailers) + "\n")

if __name__ == "__main__":
    main()
This hook dynamically inspects the developer's session state. If they used a model to generate the changes, the commit message automatically appends:
Fix API endpoint for session verification

AI-Model-Attribution: claude-3-5-sonnet-2026
AI-Code-Share-Estimate: 45%
This metadata is then parsed during the CI/CD pipeline runs to compute exact metrics for the engineering repository without manual developer overhead.
The Five Missing Metrics of the Agentic Era
To successfully run a hybrid engineering organization in 2026, leaders must track five critical metrics that traditional systems ignore.
1. Rework Rate (Stability Window)
The Rework Rate is the percentage of code lines (or blocks) that are modified, replaced, or deleted within a set stability window—typically 14 days—following their initial commit.$$Rework\ Rate = \frac{Lines\ of\ Code\ Modified\ within\ 14\ Days}{Total\ Lines\ of\ Code\ Initially\ Committed} \times 100$$
A high rework rate indicates that while the velocity of code creation is high, the quality is low. If an agent writes 500 lines of code to implement a checkout feature, but a human developer must rewrite 300 lines of it a week later due to edge-case failures, the rework rate is 60%. This indicates that the AI tool did not save time; it merely shifted the task from coding to debugging and refactoring.
2. AI Code Share (Provenance Ratio)
AI Code Share measures the ratio of machine-generated code to human-authored code within the production branch. This metric is analyzed at three levels:- Raw Volume: The total count of lines generated by models vs. typed by humans.
- Logical Density: The count of control-flow structures (if/else statements, loops, function declarations) generated by models vs. humans.
- Architectural Footprint: The number of core files or services modified by AI.
3. PR Review Load (Cognitive Burden Index)
As AI tools generate code faster, the volume of pull requests increases. The PR Review Load measures the cognitive burden placed on human senior developers who must review these proposals. It is calculated by tracking:- PR Size (LOC): The number of lines of code changed per PR.
- Review Speed: The average time spent reviewing each line of code.
- Comment Density: The number of design or logical corrections made per review.
- Merge Block Rate: How often a PR is blocked or rejected because of architectural violations.
4. DX Core 4 (Developer Friction Telemetry)
The Developer Experience (DX) Core 4 focuses on developer sentiment and operational friction:- Tool Latency: The round-trip latency of AI autocomplete suggestions and agent run completions. Slow model response times lead to cognitive context switching.
- Developer Flow State: Self-reported or calendar-derived blocks of uninterrupted time.
- Onboarding Time to First Commit: The time it takes a new hire to ship code, indicating code readability.
- Codebase Comprehensibility: A metric derived from review comments and survey data tracking how easy it is for developers to understand existing code.
5. Agent Task Success Rate (Quality Index)
For teams deploying autonomous agents, the Agent Task Success Rate measures the reliability of the agent harness:$$Agent\ Success\ Rate = \frac{Successfully\ Merged\ and\ Gated\ Agent\ Tasks}{Total\ Agent\ Task\ Executions} \times 100$$
A successful task is one that passes all linting, unit testing, security scanning, and human review gates on the first run. If an agent must run 50 times, failing tests and regenerating code repeatedly before it finally passes, it consumes model tokens and pipeline resources. This run-to-success ratio is critical for FinOps optimization.
Let us organize these metrics into an analytical comparison table:
| Metric Name | Focus Area | Data Source | Target Threshold (2026) | Primary Benefit |
|---|---|---|---|---|
| Rework Rate | Code Stability | Git commit history analysis | < 12% over 14-day window | Identifies code fragility and regression risks. |
| AI Code Share | Code Provenance | Commit metadata & IDE extensions | 30% - 50% (monitored limits) | Prevents unreadable machine-generated code bases. |
| PR Review Load | Cognitive Burden | Git PR review logs & durations | < 150 LOC per hour reviewed | Prevents rubber-stamping and reviewer burnout. |
| DX Core 4 | Developer Friction | Surveys + IDE telemetry logs | > 8.5/10 satisfaction index | Protects developer flow state and focus. |
| Agent Success Rate | Quality Control | Agent execution logs & CI pipelines | > 88% first-run gating success | Controls token cost and resource consumption. |
Metric Selection: Executive, Platform, and Product Frameworks
Not every stakeholder in an organization needs to see every metric. To prevent dashboard fatigue, engineering leaders must categorize their telemetry by target audience.
Here is the decision flowchart for selecting and routing metrics:
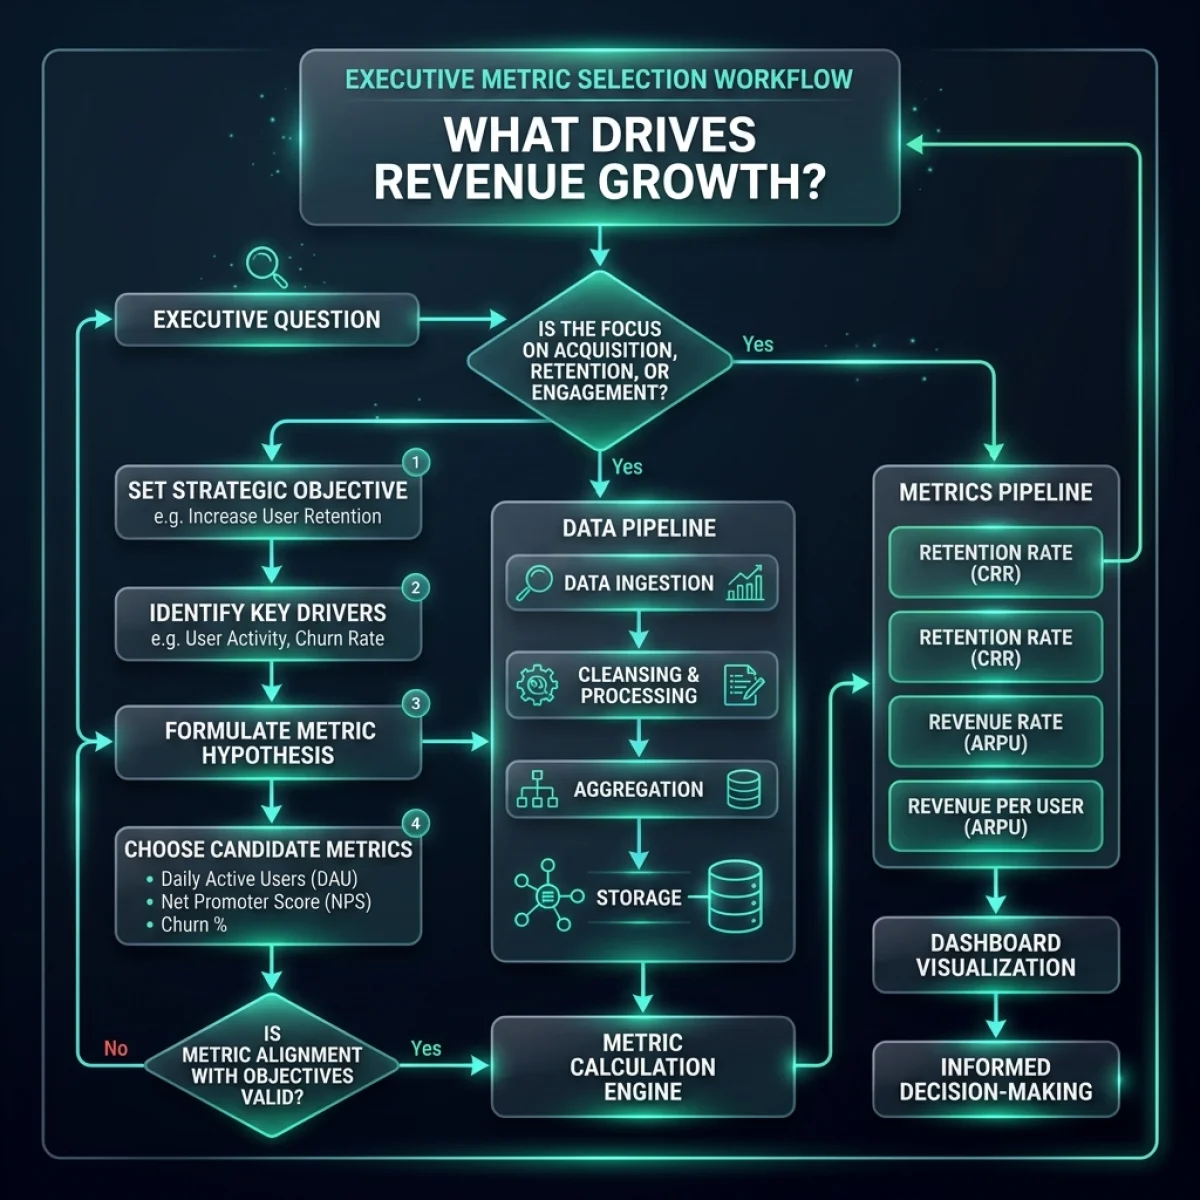
1. Executive Board Dashboard
Executives and business leaders care about ROI, delivery risk, and organizational capability. They need aggregated, high-level indicators that translate engineering metrics into financial impact.- AI ROI Index: Financial yield of AI investments computed by comparing contractor spend reduction against token/license costs.
- System Defect Escape Rate: The number of bugs escaping to production, indicating whether AI speed is compromising quality.
- Strategic Velocity: The delivery time of major product milestones, ensuring teams are shipping business value, not just code volume.
2. Platform Engineering Dashboard
Platform and developer experience teams care about infrastructure performance, cost control, and pipeline efficiency.- Agent Token FinOps: Cost per agent run, token utilization efficiency, and model routing metrics.
- CI/CD Pipeline Congestion: How agentic PR runs affect build queue wait times.
- Telemetry Health: The percentage of commits containing valid provenance metadata.
3. Product Management Dashboard
Product managers and team leads need to understand feature cycle time, team capacity, and feature stability.- Rework Hotspots: Specific modules or features suffering from high rework rates, requiring refactoring.
- Human vs. Agent Capacity: Allocation of engineering hours between strategic design (human) and boilerplate execution (agent).
- Onboarding Velocity: The time required for developers to modify code outside their immediate domain, indicating system readability.
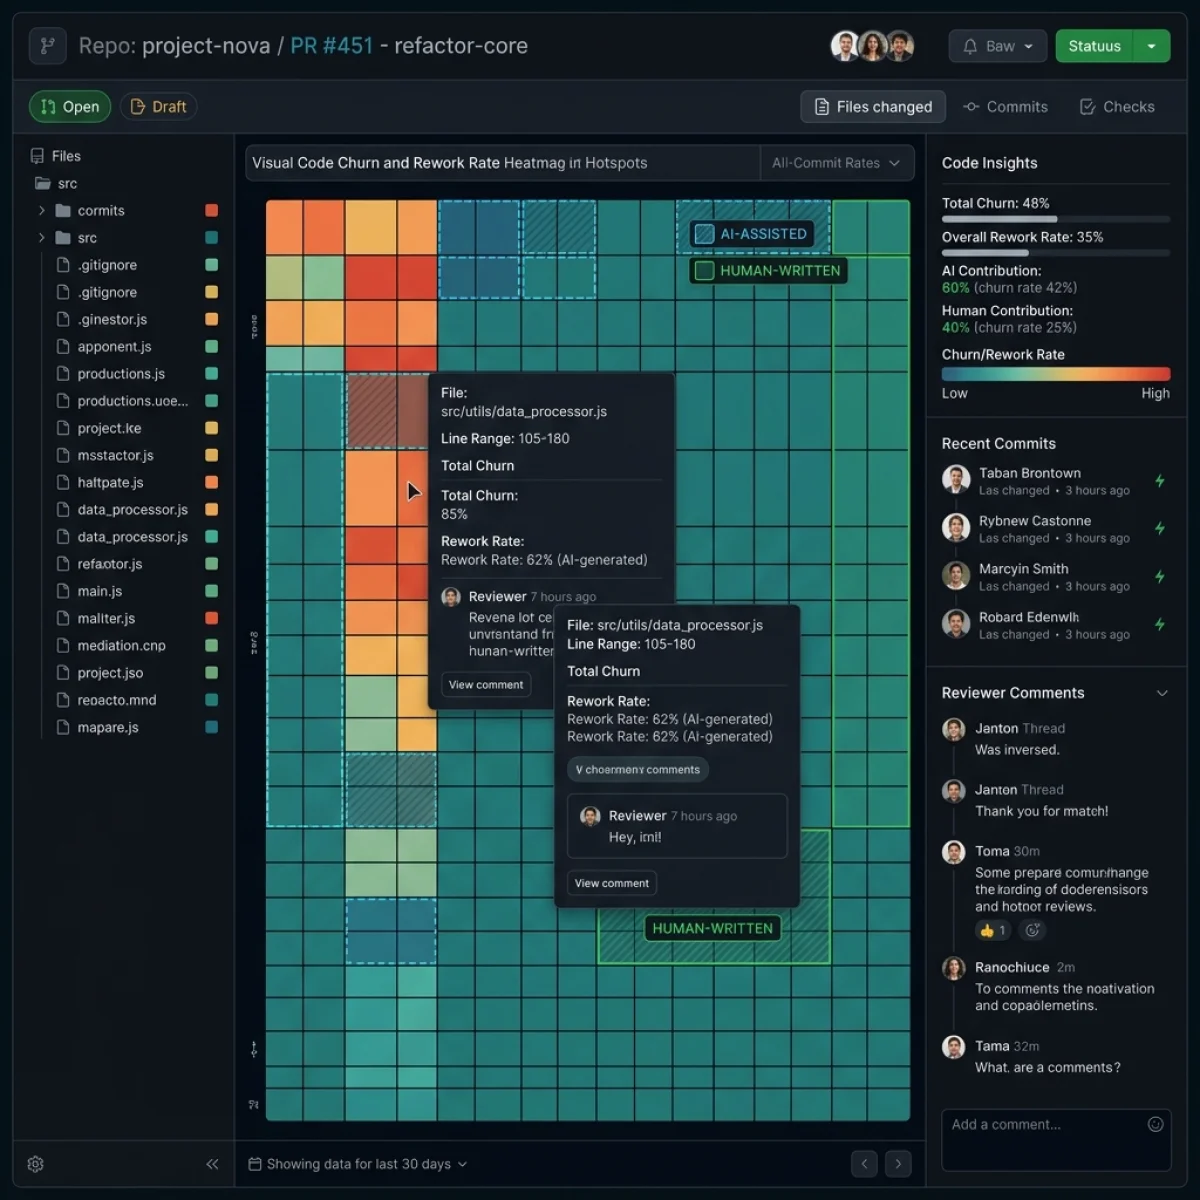
In addition to aggregated dashboard views, platform teams require code-level auditing tools to identify hotspots where AI-generated code is causing high rates of churn. This is managed via visual code heatmaps:
The 2027–2030 Transition Roadmap: From Human-Only to Hybrid Engineering
As organizations progress from basic autocomplete tools to fully autonomous agent squads, the metrics and governance models must evolve. This transition requires a structured, multi-phase roadmap:
Phase 1: Provenance Hardening (2026)
- Objective: Establish complete visibility into code authorship and prevent anonymous machine commits.
- Actions: Integrate git commit hooks to stamp commit trailers with IDE model identifiers. Implement static code analyzers to scan for model signatures. Establish baseline DORA tracking for human-only vs. hybrid changes.
- Metrics: AI Code Share, Telemetry Compliance Rate.
Phase 2: Cognitive Load Control (2027)
- Objective: Optimize the human review bottleneck and prevent reviewer burnout.
- Actions: Deploy automated PR triage assistants that summarize changes, check for style rules, and pre-validate logic. Set maximum LOC limits on agent-generated PRs. Define strict code review SLAs based on Cognitive Burden index.
- Metrics: PR Review Load, Review Speed, Merge Block Rate.
Phase 3: FinOps & Task Gating (2028)
- Objective: Align agent resource consumption with engineering outcomes.
- Actions: Implement dynamic model routing (e.g., routing simple fixes to smaller OSS models like Cohere North Mini, and complex refactors to premium models). Deploy run-time token quotas per developer/agent. Integrate deterministic sensors in CI to block runaway agent loops.
- Metrics: Agent Task Success Rate, Token Cost per Feature, Run-to-Success Ratio.
Phase 4: Autonomous Operations (2029–2030)
- Objective: Securely scale fully autonomous agent squads with minimal human intervention.
- Actions: Implement decentralized agent-to-agent (A2A) orchestration meshes with cryptographic Agent Cards. Deploy continuous verification sandboxes that run automated security, compliance, and regression tests in isolated environments. Transition to outcome-based executive auditing.
- Metrics: Multi-Agent Orchestration Efficiency, Carbon/Power per Inference Job, Autonomy Ratio.
Vatsal Shah's Executive Playbook & Practitioner Recommendations
For engineering leaders evaluating their AI metrics strategy, I recommend a structured execution framework:
The 90-Day Execution Checklist
- Audit Your Current Baseline (Days 1–30):
- Deploy Git Telemetry Hooks (Days 31–60):
- Establish a Rework Warning Gate (Days 61–90):
- Train Reviewers on Cognitive Burden Control (Ongoing):
By taking these steps, you will protect your organization from velocity theater, control technical debt, and ensure that your investments in AI engineering tools translate into real business value.
Frequently Asked Questions (FAQ)
Q1: Does the AI Attribution Layer replace classical DORA metrics?
No. The AI Attribution Layer does not replace DORA; it augments it. DORA remains useful for tracking pipeline mechanical speed and deployment flow. The attribution layer provides the necessary context, allowing you to segment those metrics by code author (human vs. machine) and measure code quality via rework rates.Q2: How does tracking AI Code Share help our developers?
It helps by protecting developer focus and codebase readability. When machine-generated code dominates a repository without strict style checks, the code can quickly become unreadable, creating severe friction for human developers. Tracking this share helps platform teams maintain system comprehensibility.Q3: What is a "rework rate" and why is a 14-day window used?
Rework rate is the percentage of code lines that are rewritten or replaced shortly after being committed. A 14-day window is the industry standard for identifying short-term regressions and code instability. If code is rewritten within two weeks, it typically indicates that the initial solution was incomplete or faulty.Q4: How do we collect metadata without slowing down developers?
Collection is fully automated. IDE extensions (like Cursor or custom plugins) automatically inject authorship tags into git commit trailers or commit metadata during the standard commit workflow. The developer does not need to perform any manual tracking steps.Q5: How do we prevent developers from rubber-stamping agentic PRs?
We implement PR Review Load gates. If a PR contains more than 500 lines of code and is approved in under five minutes, the CI/CD pipeline automatically blocks the merge and flags it for secondary review. This ensures that massive changes receive a thorough human inspection.References & Authoritative Sources
- DevOps Research and Assessment (DORA): State of DevOps Report. Google Cloud. dora.dev
- AI-Assisted Software Engineering Research: 2025 DORA AI & Developer Experience Survey (~5,000 respondents). Google Cloud Research.
- Developer Experience (DevEx) Frameworks: Nygard, M. (2024). DX Core 4: Measuring Flow and Friction in Modern Engineering Teams.
- Git Metadata & Provenance Standards: Signed Commits and Co-authored Commit Trailers. GitHub Developer Documentation. docs.github.com
- FinOps for Agentic Architectures: Model Routing and Inference Cost Management in Hybrid Environments. FinOps Foundation Research. finops.org
{
  "@context": "https://schema.org",
  "@graph": [
    {
      "@type": "BlogPosting",
      "@id": "https://agiletechguru.com/blog/dora-metrics-ai-attribution-engineering-2026#article",
      "isPartOf": {
        "@id": "https://agiletechguru.com/blog/dora-metrics-ai-attribution-engineering-2026"
      },
      "headline": "DORA Is Not Enough in 2026 — The AI Attribution Layer Engineering Leaders Actually Need",
      "description": "DORA metrics celebrate deployment frequency but mask massive rework rates. Here is the AI Attribution layer engineering leaders need to audit real impact.",
      "image": {
        "@type": "ImageObject",
        "url": "https://agiletechguru.com/uploads/content/blog/dora-metrics-ai-attribution-engineering-2026/featured-banner.webp",
        "width": 1200,
        "height": 630
      },
      "datePublished": "2026-07-14T00:00:00+00:00",
      "dateModified": "2026-07-14T00:00:00+00:00",
      "author": {
        "@type": "Person",
        "name": "Vatsal Shah"
      },
      "publisher": {
        "@type": "Organization",
        "name": "Agile Tech Guru",
        "logo": {
          "@type": "ImageObject",
          "url": "https://agiletechguru.com/assets/images/logo.png"
        }
      },
      "mainEntityOfPage": "https://agiletechguru.com/blog/dora-metrics-ai-attribution-engineering-2026"
    },
    {
      "@type": "FAQPage",
      "@id": "https://agiletechguru.com/blog/dora-metrics-ai-attribution-engineering-2026#faq",
      "mainEntity": [
        {
          "@type": "Question",
          "name": "Does the AI Attribution Layer replace classical DORA metrics?",
          "acceptedAnswer": {
            "@type": "Answer",
            "text": "No. The AI Attribution Layer does not replace DORA; it augments it. DORA remains useful for tracking pipeline mechanical speed and deployment flow. The attribution layer provides the necessary context, allowing you to segment those metrics by code author (human vs. machine) and measure code quality via rework rates."
          }
        },
        {
          "@type": "Question",
          "name": "How does tracking AI Code Share help our developers?",
          "acceptedAnswer": {
            "@type": "Answer",
            "text": "It helps by protecting developer focus and codebase readability. When machine-generated code dominates a repository without strict style checks, the code can quickly become unreadable, creating severe friction for human developers. Tracking this share helps platform teams maintain system comprehensibility."
          }
        },
        {
          "@type": "Question",
          "name": "What is a 'rework rate' and why is a 14-day window used?",
          "acceptedAnswer": {
            "@type": "Answer",
            "text": "Rework rate is the percentage of code lines that are rewritten or replaced shortly after being committed. A 14-day window is the industry standard for identifying short-term regressions and code instability. If code is rewritten within two weeks, it typically indicates that the initial solution was incomplete or faulty."
          }
        },
        {
          "@type": "Question",
          "name": "How do we collect metadata without slowing down developers?",
          "acceptedAnswer": {
            "@type": "Answer",
            "text": "Collection is fully automated. IDE extensions (like Cursor or custom plugins) automatically inject authorship tags into git commit trailers or commit metadata during the standard commit workflow. The developer does not need to perform any manual tracking steps."
          }
        },
        {
          "@type": "Question",
          "name": "How do we prevent developers from rubber-stamping agentic PRs?",
          "acceptedAnswer": {
            "@type": "Answer",
            "text": "We implement PR Review Load gates. If a PR contains more than 500 lines of code and is approved in under five minutes, the CI/CD pipeline automatically blocks the merge and flags it for secondary review. This ensures that massive changes receive a thorough human inspection."
          }
        }
      ]
    },
    {
      "@type": "BreadcrumbList",
      "@id": "https://agiletechguru.com/blog/dora-metrics-ai-attribution-engineering-2026#breadcrumb",
      "itemListElement": [
        {
          "@type": "ListItem",
          "position": 1,
          "name": "Home",
          "item": "https://agiletechguru.com"
        },
        {
          "@type": "ListItem",
          "position": 2,
          "name": "Blog",
          "item": "https://agiletechguru.com/blog"
        },
        {
          "@type": "ListItem",
          "position": 3,
          "name": "DORA Metrics AI Attribution",
          "item": "https://agiletechguru.com/blog/dora-metrics-ai-attribution-engineering-2026"
        }
      ]
    }
  ]
}