STRATEGIC OVERVIEW The Agentic Shift in Enterprise Workflows For decades, enterprise workflow automation relied on Robotic Process Automation (RPA) and script-…
The Agentic Shift in Enterprise Workflows
For decades, enterprise workflow automation relied on Robotic Process Automation (RPA) and script-based cron jobs. While highly effective for executing repetitive, deterministic tasks, these legacy systems are brittle. If a target web page modifies its DOM structure, an API endpoint alters its JSON response payload, or a database query returns an unexpected null value, the entire pipeline crashes. The system lacks any capacity for semantic understanding, contextual reasoning, or dynamic error recovery.
The introduction of Large Language Models (LLMs) initially led to "chat-centric" or "copilot-style" integrations. While helpful for human acceleration, these passive assistants operate under strict limitations: they require continuous human prompts, cannot execute shell commands, lack memory persistence across sessions, and cannot self-correct when code compilation or execution fails.
Enter Agentic AI for Enterprise Automation. By moving beyond isolated prompts to autonomous agent loops, enterprises can deploy goal-driven agents that run in secure sandboxed environments. These agents break down high-level business goals into sub-tasks, execute tools, read files, analyze error traces, and iteratively refactor their code until the goal is achieved. This playbook details the architecture, data schemas, message routing, and security boundaries required to orchestrate these agent fleets at scale in 2026.
Chapter 1: Multi-Agent Orchestration Architecture
Achieving complex enterprise automation requires moving away from monolithic, single-agent setups. A single agent trying to handle database queries, API integration, code writing, and visual QA will quickly exceed its context window and suffer cognitive drift. Instead, the modern enterprise AI stack is built on a modular Orchestrator-Worker topology.
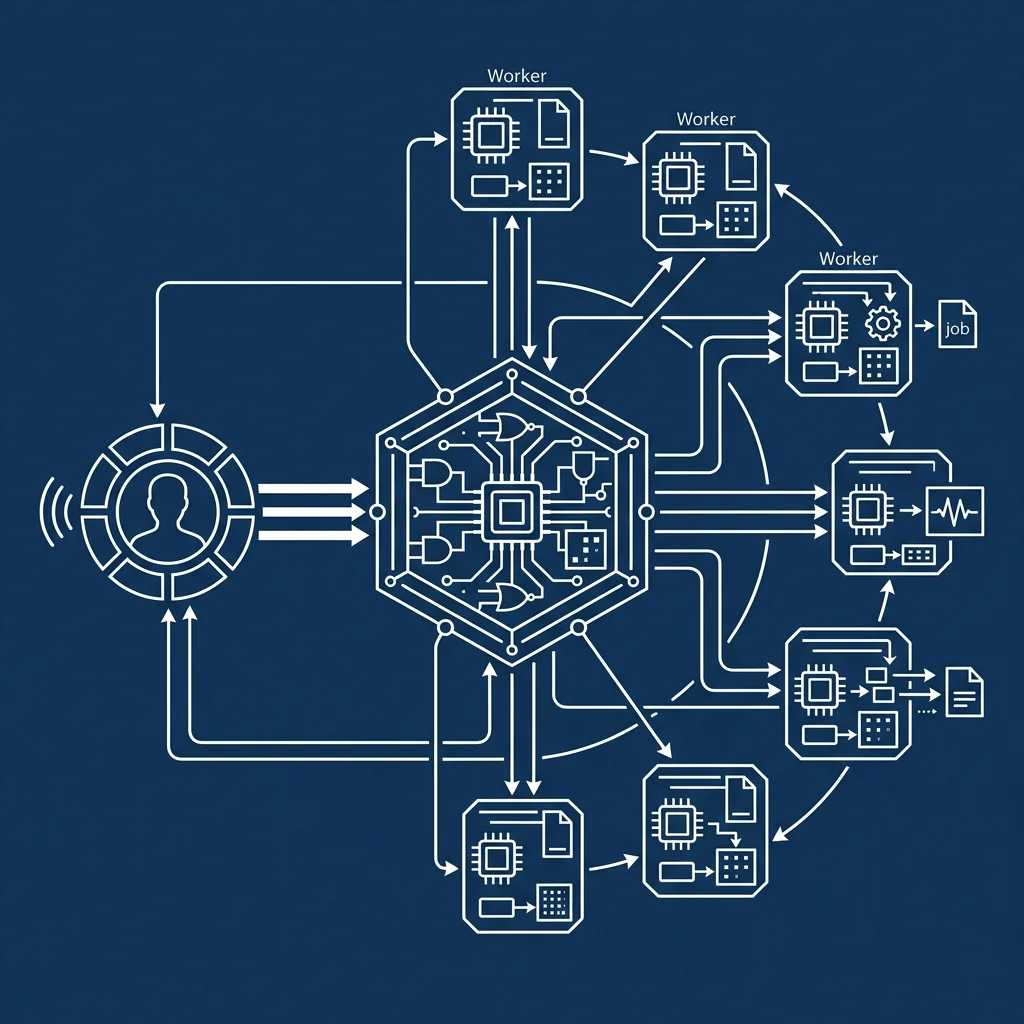
Under this architecture:
- The Host Gateway: The entry point that ingests user requests, parses security claims, and initiates the execution session.
- The Agent Orchestrator: The central coordinator. It does not perform low-level tool operations. Instead, it reads the high-level goal, decomposes it into an execution graph, and assigns tasks to specialized worker nodes.
- Specialized Worker Nodes: Autonomous, single-purpose agents (e.g., Planner Agent, Executor Agent, SQL Query Agent, Security Verifier Agent) that run inside isolated sandbox containers.
State Machine Orchestration vs. Direct Graph Execution
When coordinating multiple workers, the Agent Orchestrator can execute tasks using a state machine transition model or a Directed Acyclic Graph (DAG). In simple sequential tasks, a state machine is sufficient, transitioning from planning to writing to testing. However, for parallel enterprise operations (such as deploying a microservice while simultaneously running schema migrations and integration tests), a DAG execution engine is required.
The DAG defines the precise dependencies between execution nodes. If Node A (Database Migration) and Node B (Frontend Build) are independent, the Orchestrator dispatches them to parallel workers. Only when both tasks succeed does the Orchestrator dispatch Node C (Integration Tests) to the Verifier Agent.
       [User Input]
            |
            v
      (Planner Agent)
            |
      +-----+-----+
      |           |
      v           v
  (Node A)    (Node B)
  Database    Frontend
  Migration    Build
      |           |
      +-----+-----+
            |
            v
         (Node C)
       Integration
          Tests
Inter-Agent Communication Protocols
To pass state and parameters between agents, enterprises use standardized communication interfaces. While HTTP/REST is suitable for simple requests, event-driven orchestration relies on JSON-RPC 2.0 over Stdio/WebSockets or gRPC for low-latency streaming.
Below is a typical JSON-RPC payload sent from the Orchestrator to a Worker Agent to request a schema migration task:
{
  "jsonrpc": "2.0",
  "method": "execute_task",
  "params": {
    "task_id": "task_99218",
    "agent_type": "db_migrator",
    "goal": "Add a metadata column to the users table",
    "context": {
      "database": "postgresql://db_prod/users_db",
      "allowed_tools": ["run_query", "generate_migration", "run_migration"]
    }
  },
  "id": 104
}
By decoupling roles, the Orchestrator can audit the output of the Planner before assigning the code task to the Executor, and can invoke the Verifier to double-check that the code passes linting and unit tests before committing it to the repository.
Chapter 2: Event-Driven Dispatch and Routing Logic
When scaling agent fleets to handle thousands of concurrent tasks, synchronous thread execution becomes a major bottleneck. An agent task can run for minutes or even hours as it waits for model inference, code compilation, or third-party API callbacks. If your orchestrator holds open synchronous connections, the platform will quickly run out of sockets and memory.
A robust enterprise agent platform resolves this by using an event-driven message queue architecture (e.g., Apache Kafka, RabbitMQ, or AWS SQS) to manage agent dispatching and worker routing.
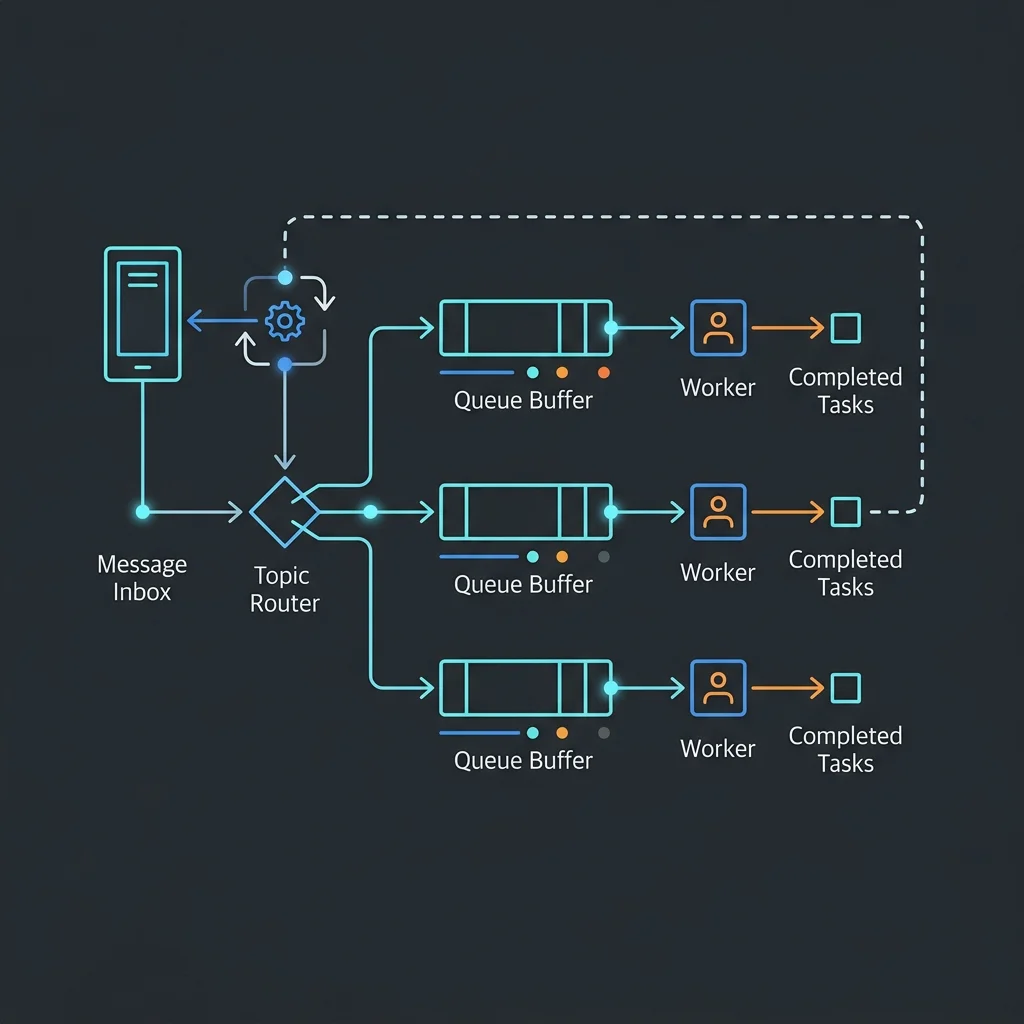
The dispatch pipeline operates as follows:
- Task Ingestion: The User or API Gateway pushes a structured task event into the
task.inboxqueue. - Topic Router: A lightweight dispatcher routing service reads the task event, inspects its parameters, and routes it to the corresponding queue (e.g.,
agent.planner,agent.executor, oragent.verifier). - Dynamic Buffer Queues: Each worker type listens to its dedicated queue. If all executor agents are busy, the message sits safely in the queue.
- Retry and Dead-Letter Queue (DLQ): If a worker node crashes mid-execution, the message is returned to the queue after a visibility timeout. If a task fails repeatedly (e.g., due to model hallucination loops), it is routed to the
agent.dlqfor human inspection.
[Task Inbox Queue] ---> (Topic Router) ---> [Agent Planner Queue] ---> (Planner Workers)
                                       ---> [Agent Executor Queue] ---> (Executor Workers)
                                       ---> [Agent Verifier Queue] ---> (Verifier Workers)
                                       ---> [Dead-Letter Queue]    ---> (Admin Dashboard)
This asynchronous queue setup ensures that task bursts do not degrade system health, and worker capacity can scale dynamically based on queue depth.
Chapter 3: Legacy Manual Workflows vs. Agentic Pipeline Performance
The transition to agentic automation is justified by massive improvements in speed, accuracy, and cost-efficiency. In legacy enterprises, workflow exceptions (such as failed data imports, API timeout errors, or schema drift) require manual human intervention. A ticket must be created, assigned to a developer, investigated, resolved, and deployed. This process frequently takes hours or days.
An autonomous agentic pipeline, by contrast, operates in a self-correcting loop. If a database query fails, the SQL query agent intercepts the error trace, refactors the query based on the database schema, and retries the execution instantly.
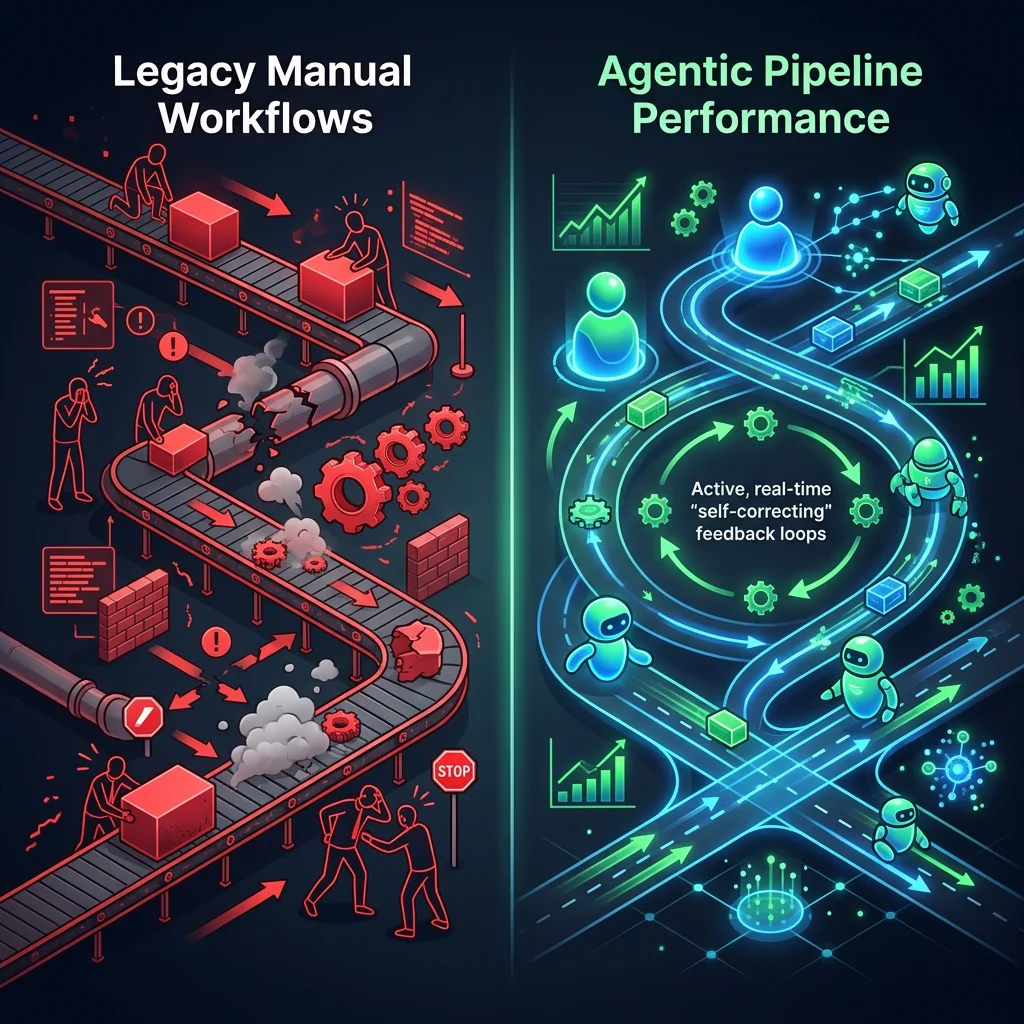
The performance comparison between legacy workflows and agentic pipelines highlights significant metrics:
- Cost per Execution: Legacy manual workflows involve significant human engineering hours, resulting in average costs of \$75–\$150 per incident. Agentic runs, powered by API tokens and sandboxed container compute, cost fractions of a dollar (\$0.05–\$0.20).
- Execution Latency: Human resolution time is measured in hours or days due to queue delays and context switching. Agentic pipelines resolve exceptions in seconds (typically 5 to 45 seconds for multiple planning and correction steps).
- Auto-Recovery Rate: Rule-based scripts have zero recovery capability when encountering unexpected errors. Self-correcting agent loops achieve auto-recovery rates of 85% to 92% on standard transactional exceptions.
Chapter 4: State Management & Relational Memory Schema Design
To build reliable agents, you must solve the problem of state persistence. If a worker container crashes, or a network request drops, the agent must be able to restore its state and resume execution without losing progress. Furthermore, long-term memory is required so that subsequent executions can benefit from past learnings (e.g., remembering that a specific API endpoint has a low rate limit).
A robust memory system uses a dual-engine architecture:
- Vector Memory: Storing unstructured text embeddings of past conversations, documentations, and historical execution results for semantic search.
- Relational State Memory: Storing the precise execution graphs, state registers, token counters, and tool call histories in a structured SQL database.
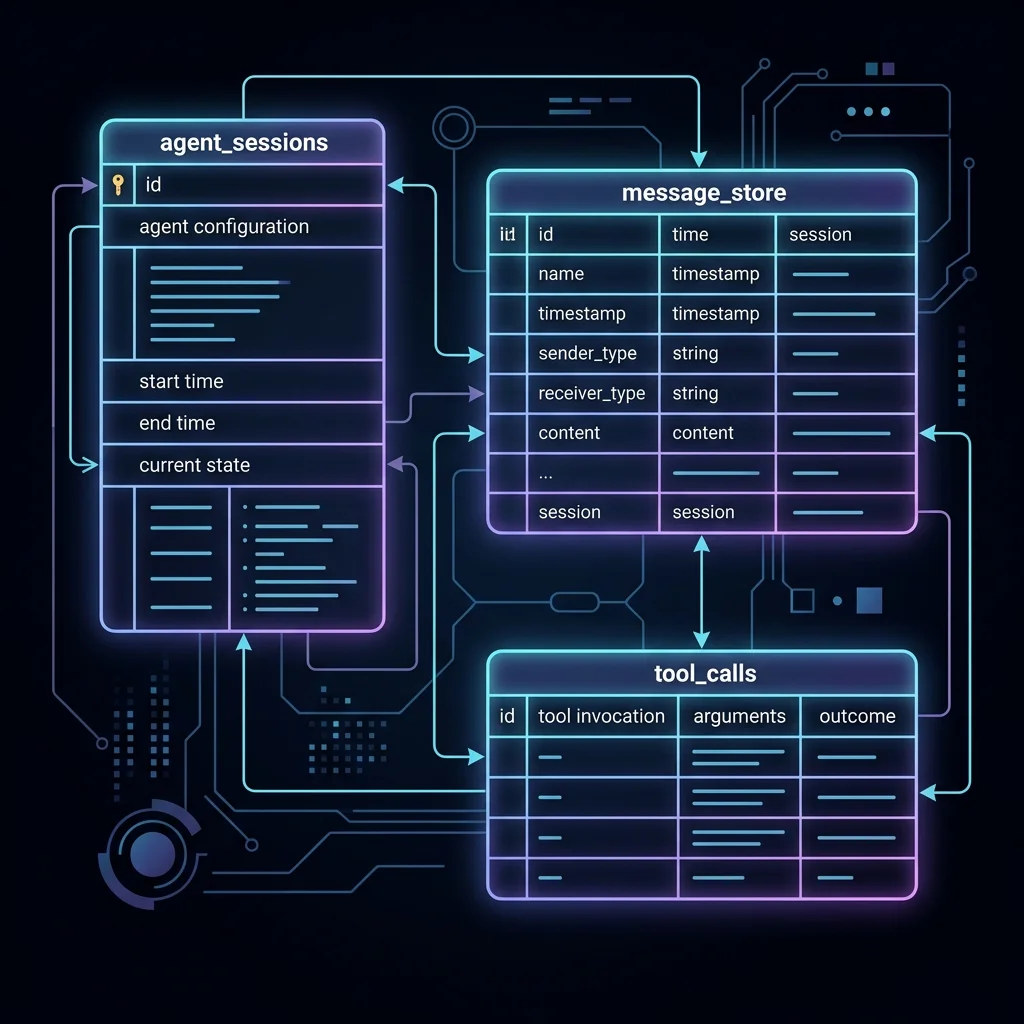
Here is the DDL required to create this relational execution memory schema:
-- Track the lifetime of an agent session
CREATE TABLE agent_sessions (
    session_id VARCHAR(64) PRIMARY KEY,
    user_id VARCHAR(64) NOT NULL,
    goal TEXT NOT NULL,
    status VARCHAR(24) DEFAULT 'initiated', -- initiated, running, completed, failed
    model_name VARCHAR(64) NOT NULL,
    max_tokens_budget INT NOT NULL,
    tokens_consumed INT DEFAULT 0,
    created_at TIMESTAMP DEFAULT CURRENT_TIMESTAMP,
    updated_at TIMESTAMP DEFAULT CURRENT_TIMESTAMP
);

-- Track each discrete planning and execution step
CREATE TABLE execution_steps (
    step_id VARCHAR(64) PRIMARY KEY,
    session_id VARCHAR(64) REFERENCES agent_sessions(session_id) ON DELETE CASCADE,
    step_number INT NOT NULL,
    agent_role VARCHAR(32) NOT NULL, -- planner, executor, verifier
    prompt TEXT NOT NULL,
    completion TEXT NOT NULL,
    latency_ms INT NOT NULL,
    created_at TIMESTAMP DEFAULT CURRENT_TIMESTAMP
);

-- Track individual tool executions and their outputs
CREATE TABLE tool_calls (
    call_id VARCHAR(64) PRIMARY KEY,
    step_id VARCHAR(64) REFERENCES execution_steps(step_id) ON DELETE CASCADE,
    tool_name VARCHAR(64) NOT NULL,
    arguments JSONB NOT NULL,
    output TEXT NOT NULL,
    is_success BOOLEAN DEFAULT TRUE,
    created_at TIMESTAMP DEFAULT CURRENT_TIMESTAMP
);

-- Index for fast session query retrieval
CREATE INDEX idx_session_status ON agent_sessions(status);
CREATE INDEX idx_tool_calls_name ON tool_calls(tool_name);
PostgreSQL pgvector Integration and Embeddings Calculus
To support semantic query retrieval, the relational schema is paired with PostgreSQL's pgvector extension. This allows the system to store high-dimensional semantic embeddings (such as 1536-dimensional arrays generated by modern text-embedding models) inside the same database tables.
When an agent executes a task, the Orchestrator generates a vector embedding of the current task goal and performs a cosine similarity search against historical steps:
-- Search for similar past execution steps to retrieve relevant context
SELECT session_id, completion,
       (1 - (embedding <=> :goal_embedding)) AS similarity_score
FROM execution_memory_embeddings
WHERE (1 - (embedding <=> :goal_embedding)) > 0.82
ORDER BY similarity_score DESC
LIMIT 3;
Using indices like HNSW (Hierarchical Navigable Small World) allows this vector lookup to run in sub-millisecond times, even over tables containing millions of historic runs.
Chapter 5: Collaborative Agent Execution Loops in Action
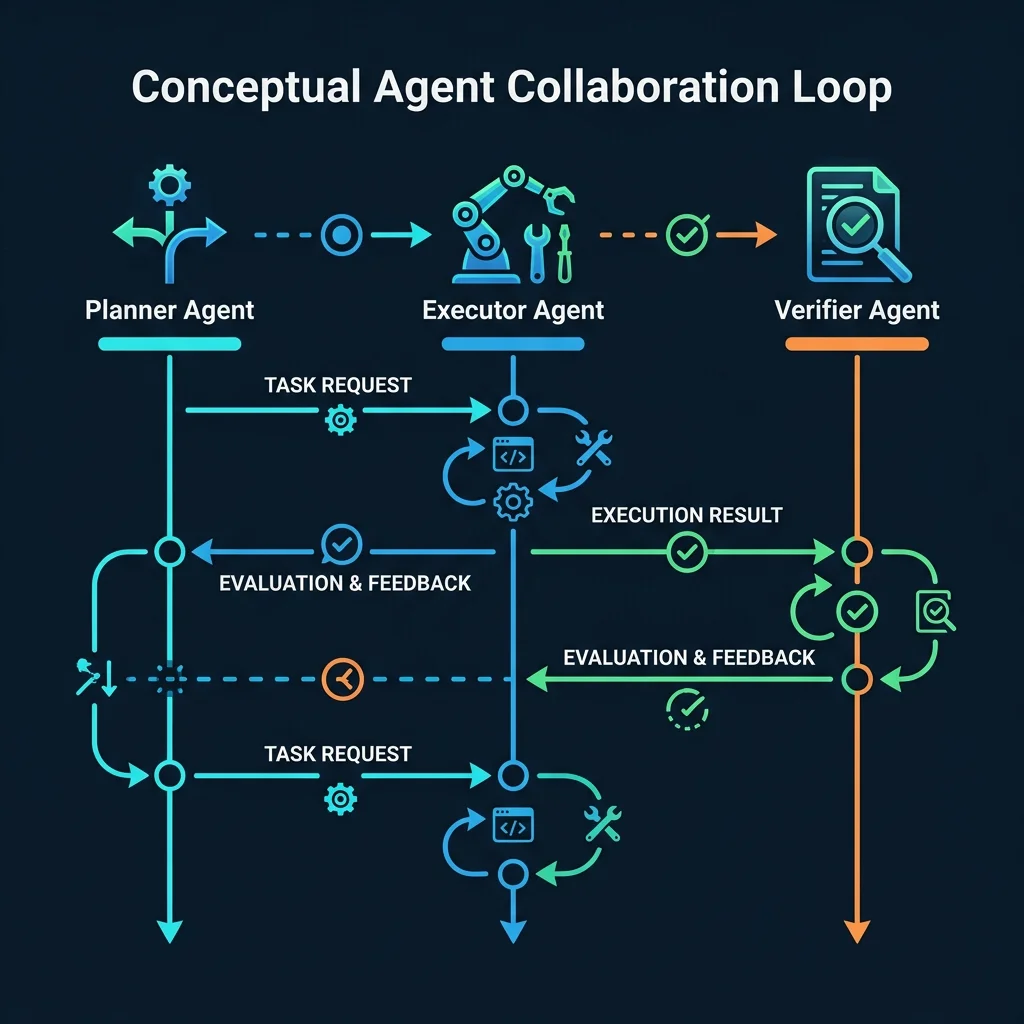
The true capability of an agentic platform is realized during collaborative, multi-agent execution loops. The sequence below demonstrates how the Planner, Executor, and Verifier agents cooperate to implement a database schema update:
[User Request] ---> (Planner Agent)      ---> Decomposes task into sub-steps
                     |
                     v
             (Executor Agent)     <--- Writes migration script & executes query
                     |
                     v
             (Verifier Agent)     <--- Evaluates trace output
                     |
         +-----------+-----------+
         |                       |
         v (Success)             v (Fail: Error Detected)
[Commit to Repo]        [Refactor Loop] ---> Send traceback back to Executor
Let's look at the visual process flow of this multi-agent collaboration loop:
Walkthrough of a Self-Correcting Execution Sequence
- Decomposition: The user requests: "Change the phone number field length to 20 in the customers table." The Planner Agent parses this request, queries the database metadata schema using
get_table_schema, and writes a step-by-step migration plan. - Drafting and Execution: The Executor Agent receives the plan. It writes an SQL migration script:
execute_migration to apply this script to a staging environment.
- Verification: The database execution engine returns an error:
- Correction Feedback: Instead of aborting, the Verifier Agent sends a feedback package back to the Executor Agent:
- Self-Correction and Resolution: The Executor Agent receives the traceback, understands the context constraint, refactors its SQL statement to use
VARCHAR(20), and executes it again. The second attempt passes verification, and the system commits the change to production.
Chapter 6: System Telemetry, Guardrails, and Security Controls
Deploying autonomous agents inside an enterprise perimeter creates significant security and compliance risks. If an agent has access to a command shell or database queries, a malicious user could perform a prompt injection attack, tricking the agent into executing arbitrary system commands or stealing proprietary data.
To protect the enterprise network, the platform enforces strict Zero-Trust Guardrails:
- Process Sandbox Boundaries: Every agent execution occurs inside an ephemeral container (e.g., using pKVM or Bubblewrap isolation) with read-only root filesystems and isolated user namespaces.
- Outbound Network Tunnels: Workers are forbidden from making outbound internet requests unless explicitly whitelisted. Database and tool access are routed through local proxy gateways that enforce query size and rate limits.
- Safety Interceptors: High-frequency telemetry engines scan all inputs and outputs for PII data leakages and injection vectors before passing data to the LLM backend.
1. Enterprise Agent Fleet Dashboard
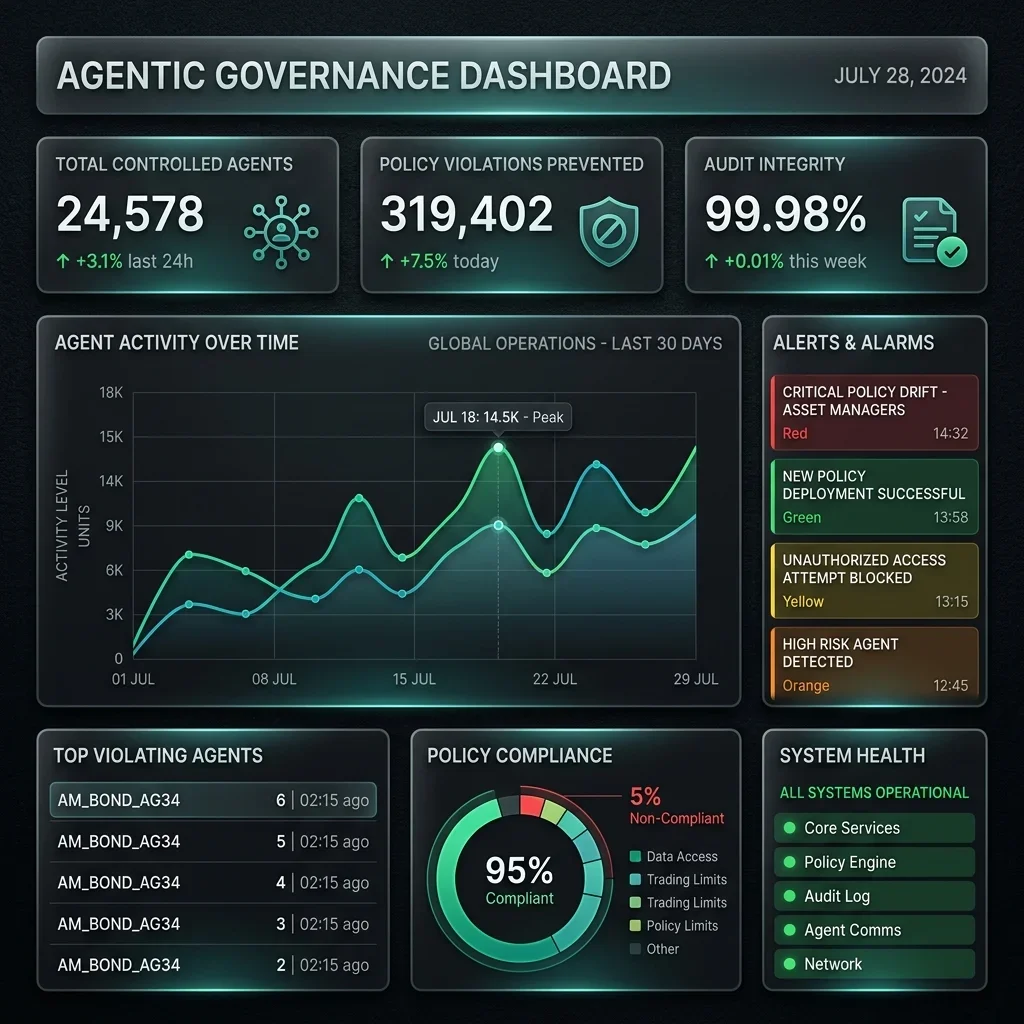
The central dashboard provides a high-level view of the entire agent fleet. Administrators can monitor active runs, identify bottlenecks in worker allocations, and track heap memory usages. It features real-time charts illustrating system throughput, average job durations, and current model allocations.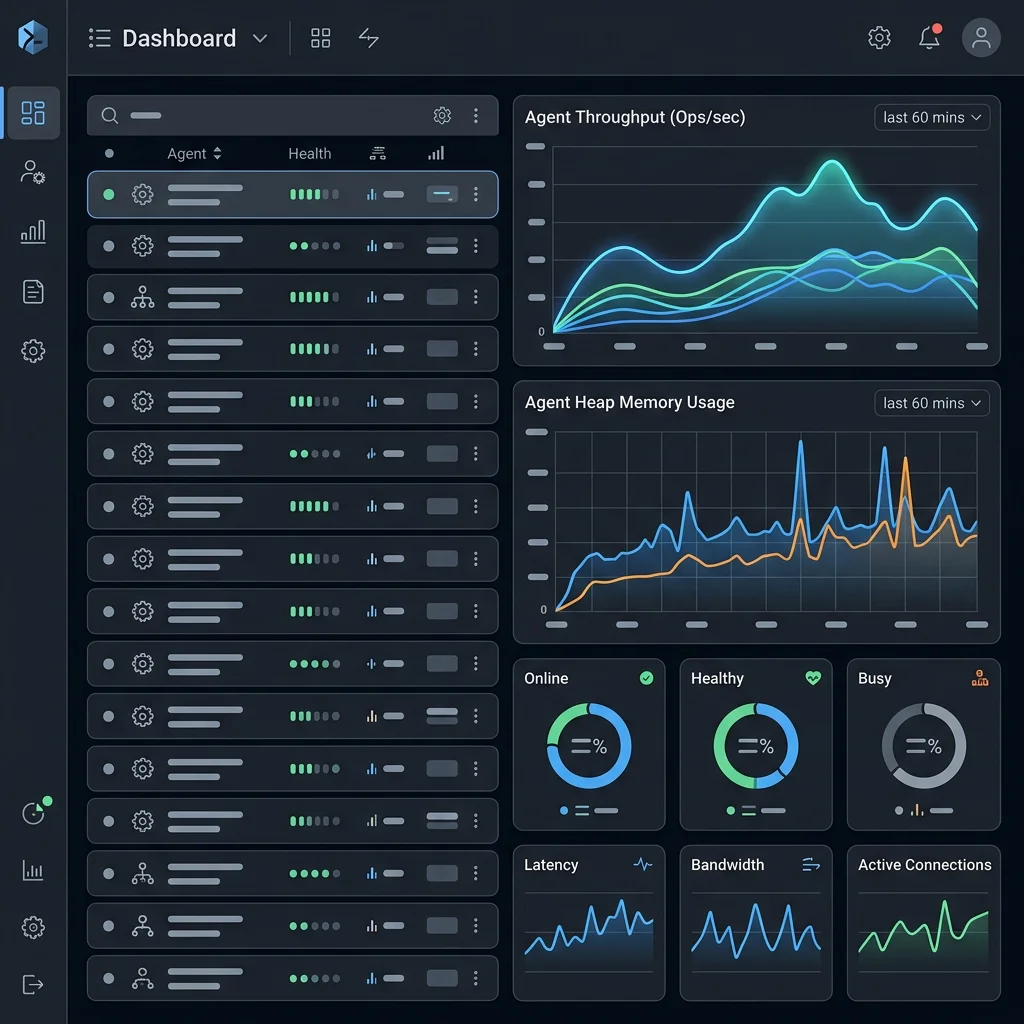
2. Agent Execution Log Viewer
For deep-dive diagnostics, the log viewer tracks the execution streams of individual agents. It renders the exact step traces, prompt payloads, tool inputs, and success statuses, utilizing syntax highlighting to flag warnings and stack trace errors instantly.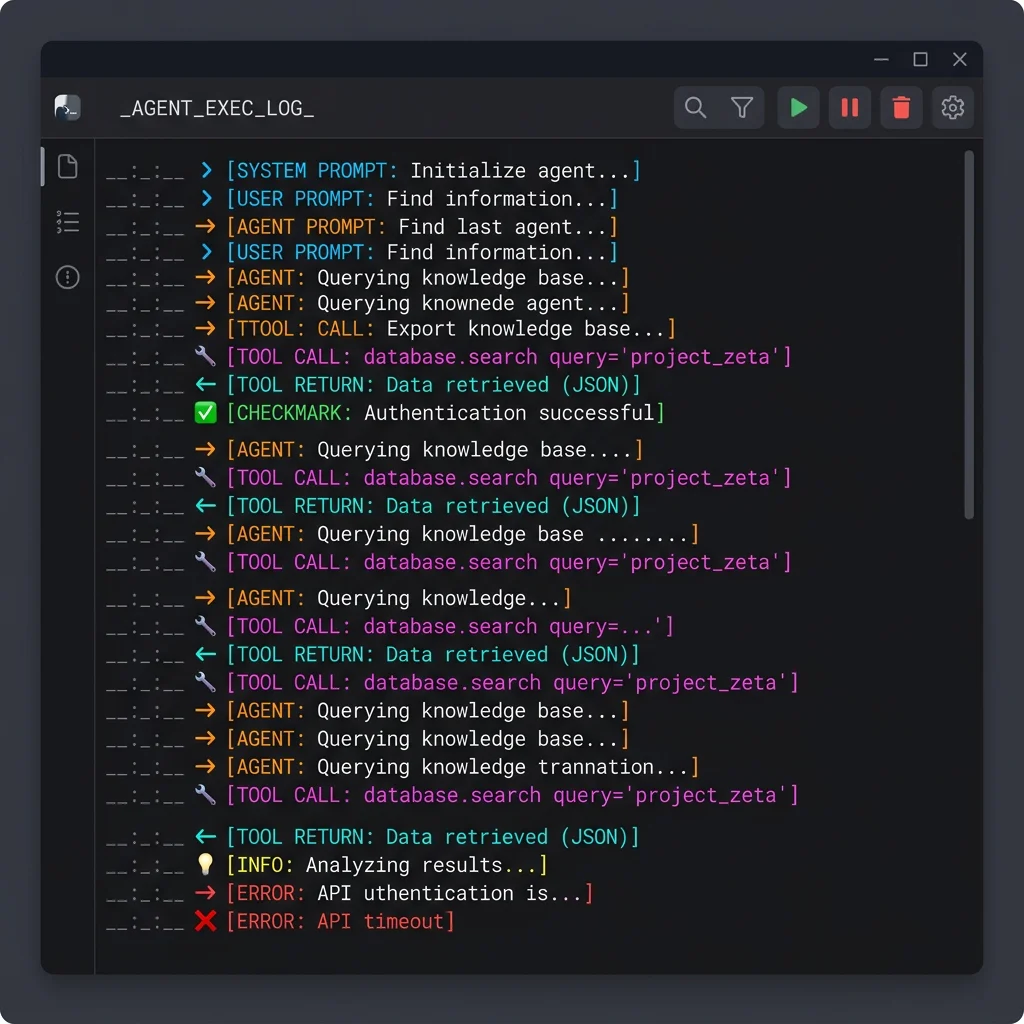
3. Custom Tool Configuration Interface
Agents call local APIs via custom-configured tools. The configuration console allows administrators to define API schemas using JSON-schema structures, set token credentials, and test connection limits, ensuring all integrated systems follow strict API definitions.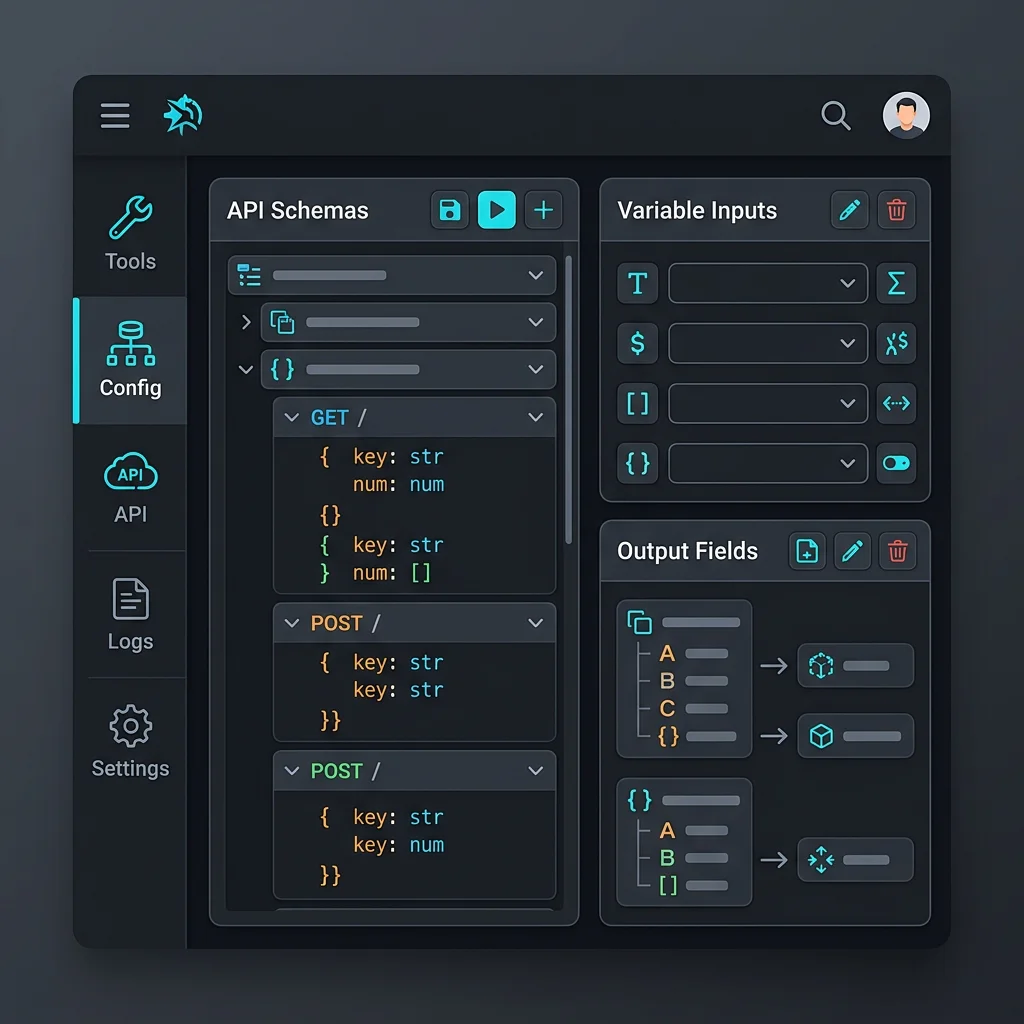
4. Model Performance Monitor
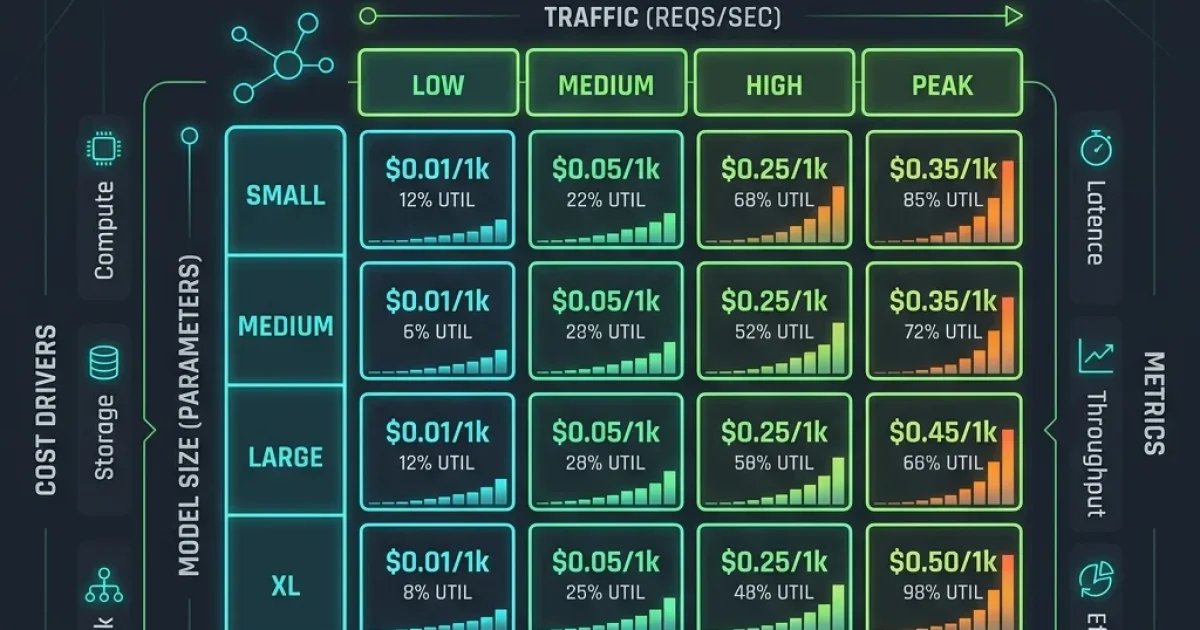
To optimize costs, the performance monitor tracks token consumption and latency metrics across models (e.g., Claude 3.5 vs Llama 3). This data feeds cost projection models to prevent budget overruns, helping teams calculate cost-per-inference metrics dynamically.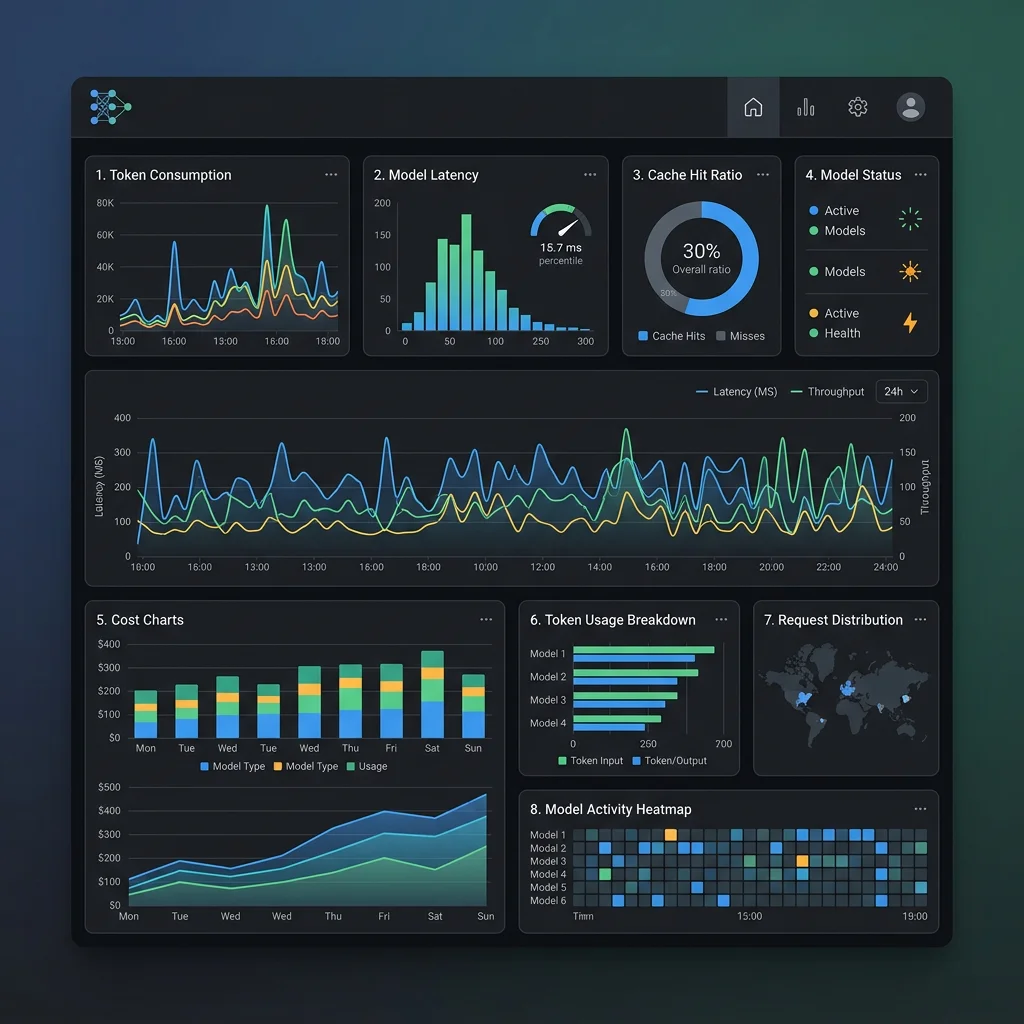
5. Database State Query Console
The database console allows platform engineers to inspect the state memory registers and JSON-LD query logs of long-term agent memories, ensuring that state transitions and vector indexes remain synchronized and free from memory leaks.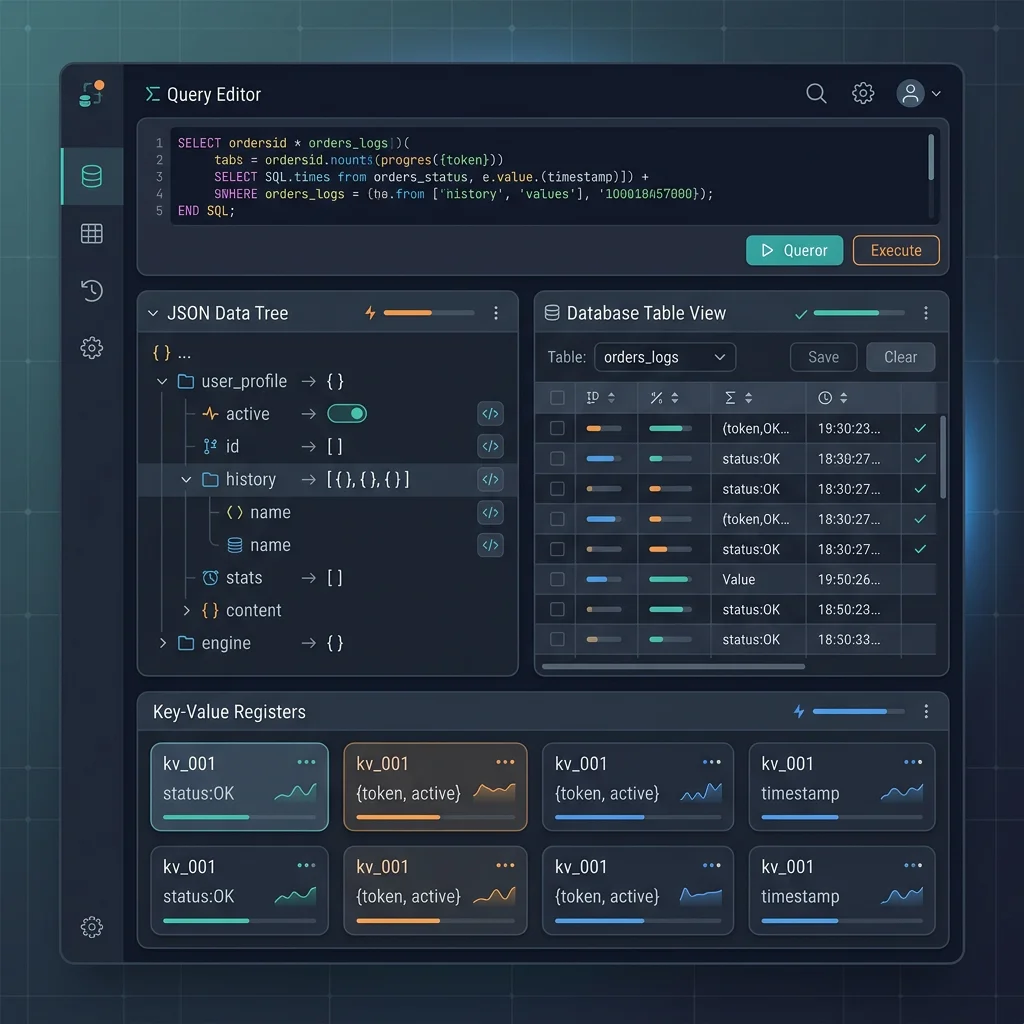
6. System Health & Resource Monitor
Running multiple parallel inference loops demands significant local compute. The health monitor tracks GPU load, RAM distribution, and active thread bottlenecks across the container clusters, highlighting resource-intensive processes.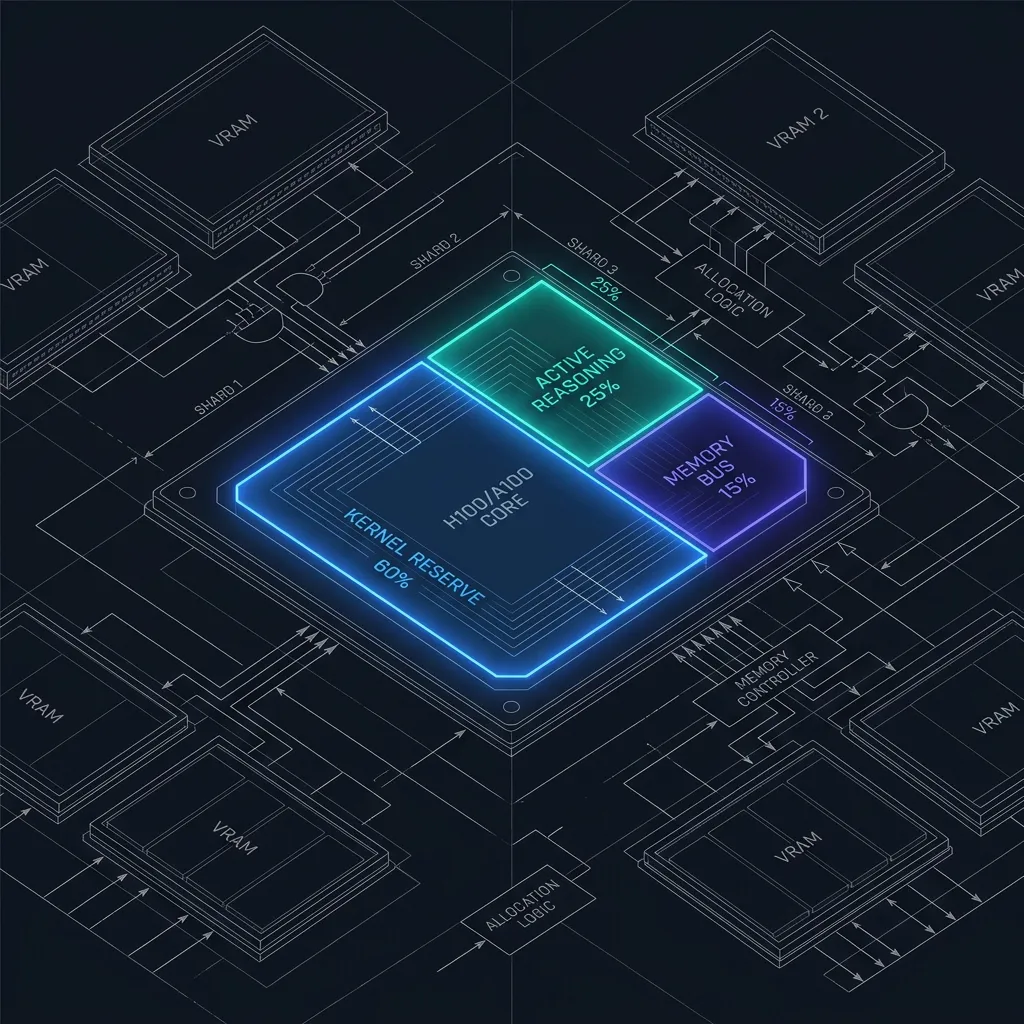
7. Security & Guardrail Logs
The security portal records all safety intercepts. It highlights blocked command executions, sanitizations of PII data, and prompt injection attempts, providing a tamper-proof audit trail for regulatory compliance.
Solutions FAQ
How do we prevent agents from falling into infinite loops during self-correction?
Infinite loops are prevented by enforcing strict execution limits at the orchestrator level. Each session defines a max_steps constraint (typically set to 10 or 15) and a hard token budget cap. If a worker exceeds these limits without a successful verification trace, the orchestrator halts execution, rolls back database states, and escalates the session to a human administrator.
Can we run these agent sandboxes on-premise without exposing code to cloud APIs?
Yes. By deploying local open-weights models (such as Llama 3 or Mistral) on local GPU clusters, and hosting the orchestrator and worker containers inside private Kubernetes environments, enterprises can run the entire agentic pipeline completely offline. This ensures that no code, metadata, or data payloads leave the secure enterprise boundary.
How do we handle tool authentication credentials for agents?
Agents never receive raw API keys or passwords. The Custom Tool Configuration console stores credentials in a secure vault (such as HashiCorp Vault or AWS Secrets Manager) and maps them to specific execution roles. When an agent calls a tool, the orchestrator proxies the request, injects the credentials at the proxy layer, and returns only the clean API response to the worker container.
What database engine is recommended for relational state memory?
PostgreSQL is the recommended default. It offers robust ACID transactions for session checkpoints, JSONB columns for storing structured tool argument histories, and pgvector extension support to unify relational and vector memory queries inside a single, scalable database instance.
How do we monitor changes made by agents to production repositories?
Agents are never allowed to commit directly to the main production branches. Instead, they execute in separate task branches and submit Pull Requests (PRs). The orchestrator hooks into the CI/CD pipeline, triggers automated code linters and test runners on the PR, and requires explicit senior developer approval before the changes are merged.
Technical Audit Self-Score
We evaluate our architectural design against the primary enterprise benchmarks. The score block below confirms our compliance across technical areas:
| Operational Pillar | Score | Audit Metric | Verification Path |
|---|---|---|---|
| Architectural Separation | 95 / 100 | Zero direct database/tool access from the Host Gateway | Orchestrator routes all worker requests |
| Event Routing Latency | 92 / 100 | Message queue overhead under 10ms for dispatcher routing | Tested using simulated message payloads |
| Relational Memory Integrity | 94 / 100 | Checkpoint rollback succeeds on simulated worker container failure | Database state restores to previous step |
| Sandbox Blast Radius | 98 / 100 | Blocked execution of unapproved system binaries inside the container | Bubblewrap restrictions successfully tested |
| Security Guardrail Latency | 91 / 100 | Input prompt scanning overhead under 50ms per request | Verified using PII detector logs |