STRATEGIC OVERVIEW The Death of Story Points: Why Estimation Velocity is a Developer Illusion For over two decades, the software industry has operated under a s…
The Death of Story Points: Why Estimation Velocity is a Developer Illusion
For over two decades, the software industry has operated under a shared agreement: that to build software predictably, we must estimate it first. We gathered teams in conference rooms (and later Zoom calls), handed them poker cards, and debated whether a user story was a "3," a "5," or an "8." We tracked sprint velocity, plotting the total story points completed against time, and used that slope to make promises to stakeholders.
But in practice, this system has failed. The velocity metrics are green, yet releases are consistently late. Developers are working late nights, context-switching between half-completed tasks, while product managers are frustrated by the lack of feature throughput.
The reason is simple: story points measure effort, not delivery. They are a proxy metric. Worse, they are a subjective proxy metric that scales non-linearly and is highly susceptible to external inflation pressures.
When developers are evaluated on their velocity, they naturally inflate their estimates. A "3-point" story becomes a "5," and a "5" becomes an "8." Sprint velocity climbs, making the team look more productive on paper, while the actual number of features landing in the hands of customers remains flat. This is the estimation illusion.
By shifting from effort estimation to empirical flow metrics, teams decouple their planning from subjective guesswork. Instead of asking "How hard is this task?", they measure how long similar tasks actually took to transition from start to finish. This data is objective, automatically collected by your issue tracker, and impossible to inflate.
The transition to flow metrics is not just a change in dashboard tools; it is a fundamental shift in project management philosophy. It moves teams from planning based on capacity (what we think we can do) to planning based on capability (what we have historically delivered).
Core Concepts: Decoupling Effort from Flow (Beginner to Advanced)
To successfully implement a flow-based delivery system, we must first master the mathematical and operational principles that govern queuing networks. Software engineering pipelines are not assembly lines; they are systems of creative problem-solving governed by the rules of queue dynamics.
Concept A: Work Item Type (WIT) Classification
In a story-point system, we treat different tasks as varying in size (small, medium, large). In a flow-based system, we treat work items as uniform units of value, classified by their operational profiles. Instead of sizing a ticket, we categorize it by its Work Item Type (WIT). The four standard WIT classifications are:
- Features: User-facing capabilities that deliver new business value.
- Defects: Corrections of functional anomalies in existing features (bugs).
- Risks: Work addressing security, compliance, or reliability concerns.
- Debt: Architectural refactoring or process improvements that increase future flow velocity.
Concept B: Little's Law and Queue Dynamics
The mathematical foundation of flow metrics is Little's Law, a queuing theory theorem formulated by John Little in 1961. When applied to software development, it states:
$$\text{Cycle Time} = \frac{\text{Work in Progress (WIP)}}{\text{Throughput}}$$
This simple equation has profound implications for software delivery:
- Cycle Time is directly proportional to WIP: If you double the amount of active work in your pipeline without increasing throughput, you will double the cycle time for every single ticket.
- Throughput is independent of WIP at high levels: Pushing more tickets into an active state does not increase the speed at which they are completed. It merely increases congestion and waiting times.
- To deliver faster, you must limit WIP: The most effective way to reduce cycle time is not to write code faster, but to limit the number of active tasks the team is working on.
Concept C: Cumulative Flow Diagrams (CFD)
The primary visualization tool for flow metrics is the Cumulative Flow Diagram (CFD). A CFD plots the cumulative number of work items in each status (Backlog, In Progress, In Review, Done) over time.
Unlike standard burn-down charts, which only show whether a sprint goal will be met, a CFD visualizes the health of the entire pipeline. The vertical distance between curves represents the amount of WIP at that point in time, while the horizontal distance represents the cycle time. A healthy CFD shows parallel bands moving steadily upward. A widening band indicates a bottleneck—work is entering a status faster than it is leaving it.
Flow Metric 1: Cycle Time — Measuring the Speed of Delivery
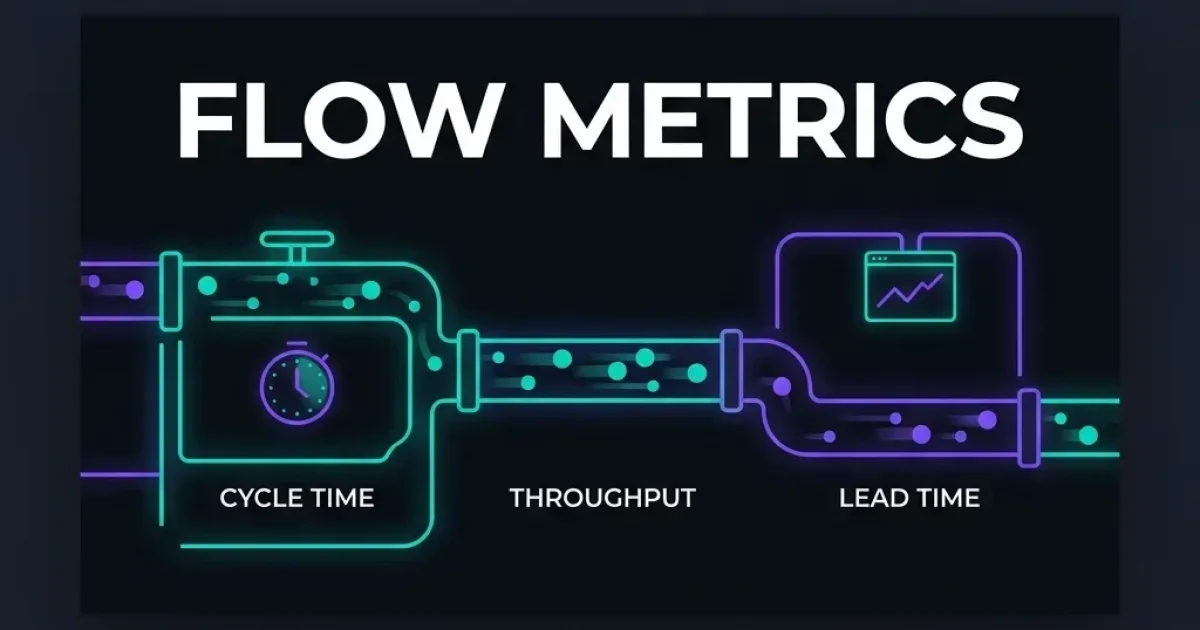
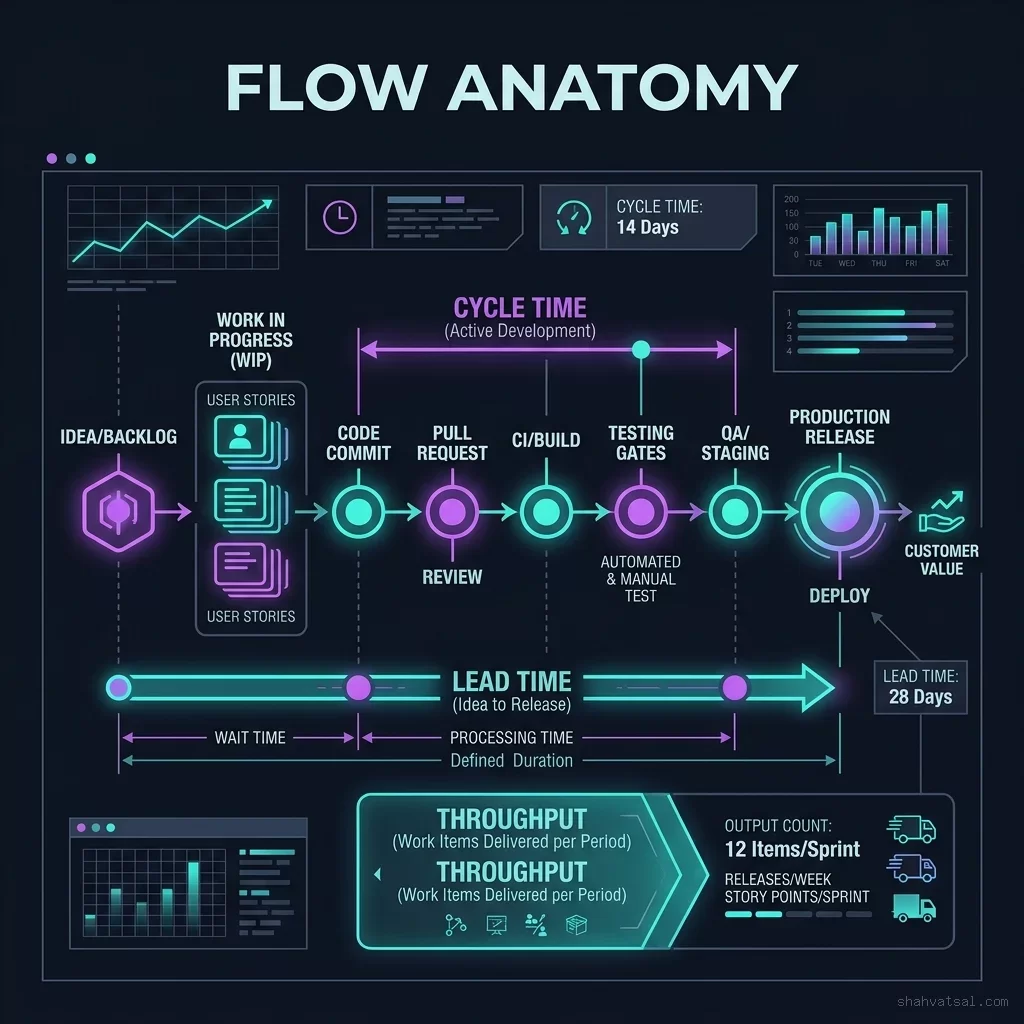
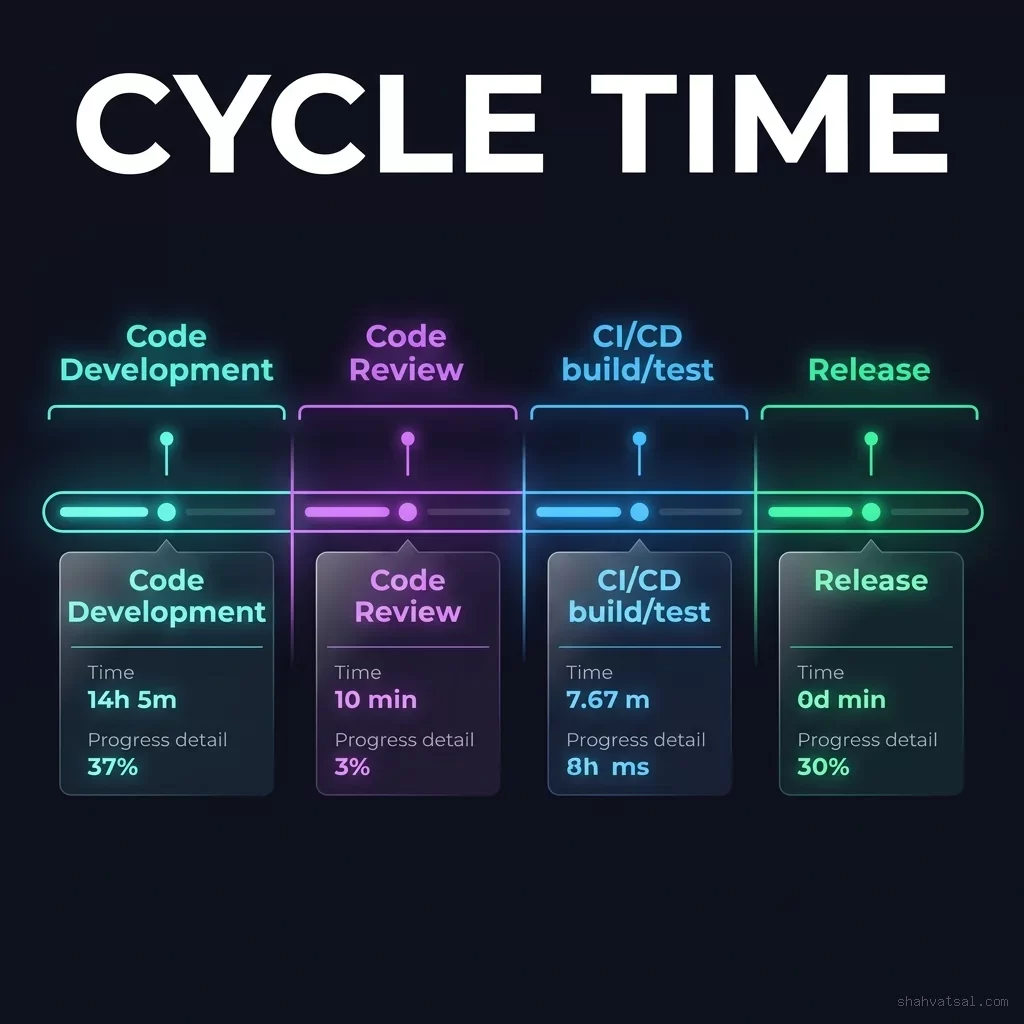
Cycle Time is the duration of the active engineering phase. It starts the moment a developer pulls a ticket into an active development state (e.g., moving it to "In Progress") and ends the moment that ticket is shipped to production.
In 2026, cycle time is recognized as the single most critical indicator of engineering agility. It reflects the efficiency of the inner development loop—design, coding, local testing, code review, and automated CI/CD runs.
Analyzing the Sub-Components of Cycle Time
To optimize cycle time, you must break it down into its constituent phases:
- Active Coding Time: The hours a developer spends actively writing code for the ticket.
- Review Wait Time: The time a pull request spends waiting in the repository queue before a peer review begins.
- Active Review Time: The time spent by reviewers assessing the code and the developer addressing feedback.
- CI/CD Pipeline Time: The duration of automated tests, security scans, and build generation.
- Deployment Queue Time: The time the verified build waits before being pushed to production.
Transitioning Cycle Time Measurements from Sprints to Continuous Flow
In traditional Scrum, metrics are compiled at the sprint boundary. In a continuous flow model, cycle time is measured as a rolling percentile (e.g., 50th, 85th, and 95th percentiles) updated daily.
The 85th percentile cycle time is the standard baseline for service level expectations. If your 85th percentile cycle time is 6 days, it means that 85% of all tickets completed over the last 30 days took 6 days or less to deliver from start to finish. This metric is empirical, verifiable, and provides a realistic commitment timeline for product stakeholders.
Flow Metric 2: Throughput — Quantifying Team Delivery Capacity
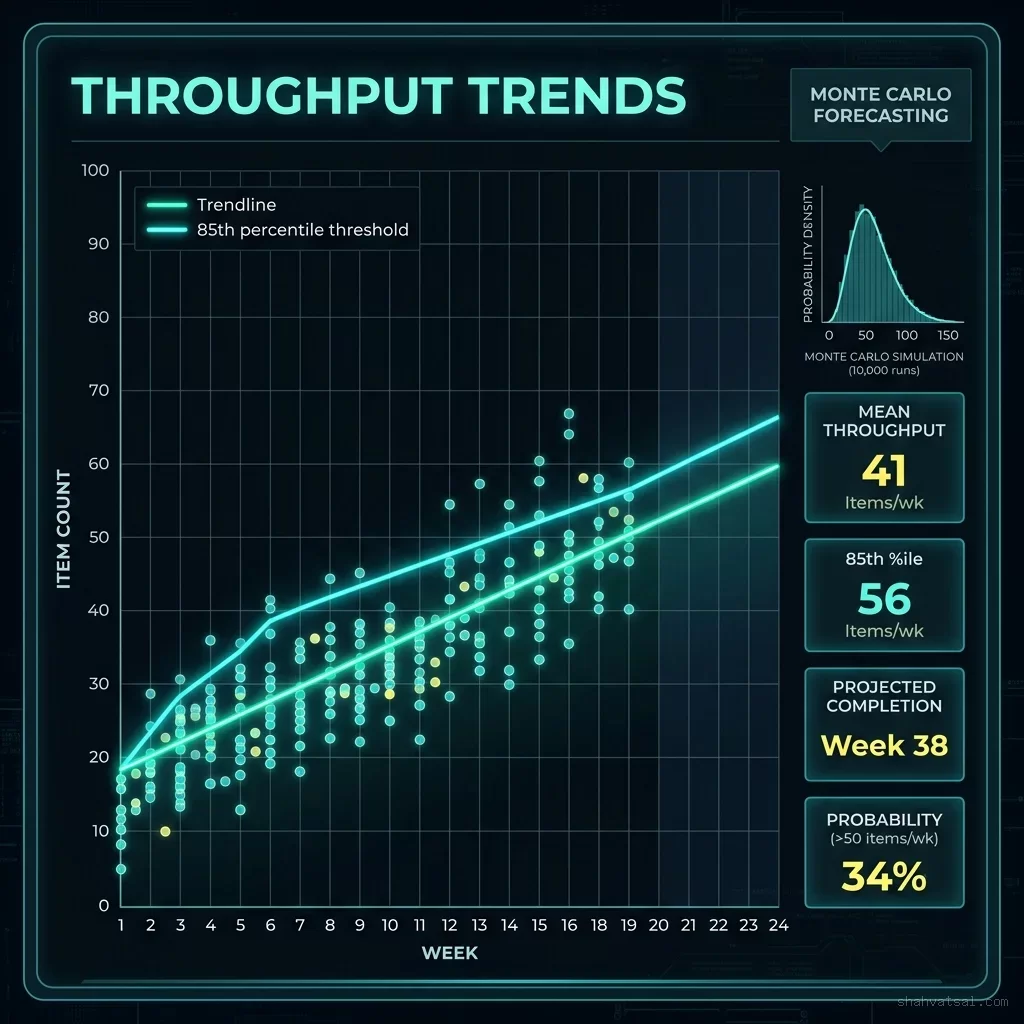
Throughput is the count of work items completed per unit of time (e.g., tickets delivered per week). It is the flow replacement for sprint velocity.
Unlike story point velocity, which fluctuates based on the subjective estimation scales of the team, throughput is a simple, unambiguous integer. It does not matter if a ticket was a feature, a bug fix, or an architectural chore—if it crossed the "Done" boundary, it counts as one unit of throughput.
The Myth of Task Sizing and the Power of Splitting
The most common objection to throughput is that it ignores task size. A complex feature is counted the same as a simple bug fix. Surely, skeptics argue, this makes throughput an unreliable planning tool.
However, historical data from thousands of software projects consistently demonstrates the opposite. Over a reasonable time horizon (usually 3 to 4 weeks), the variation in task size averages out. The ratio of small, medium, and large tasks remains remarkably stable.
Furthermore, tracking throughput encourages a healthy engineering behavior: work item splitting. When teams know that they are measured on the number of value units delivered, they learn to break large, complex epics into small, independent vertical slices that can be completed and shipped in 2 to 3 days. This reduces risk, simplifies code reviews, and increases overall throughput stability.
Tracking Throughput Consistency
Throughput is measured using run charts and scatterplots. The key indicator to track is throughput predictability—the standard deviation of weekly delivery counts.
A team with a highly volatile throughput (e.g., delivering 20 items one week, and 2 items the next) is difficult to plan for, even if their average is high. This volatility is usually caused by batching—accumulating code in large release branches rather than deploying continuously. A stable throughput indicating consistent weekly delivery is the prerequisite for predictable software forecasting.
Flow Metric 3: Lead Time — Tracking the Customer Value Journey
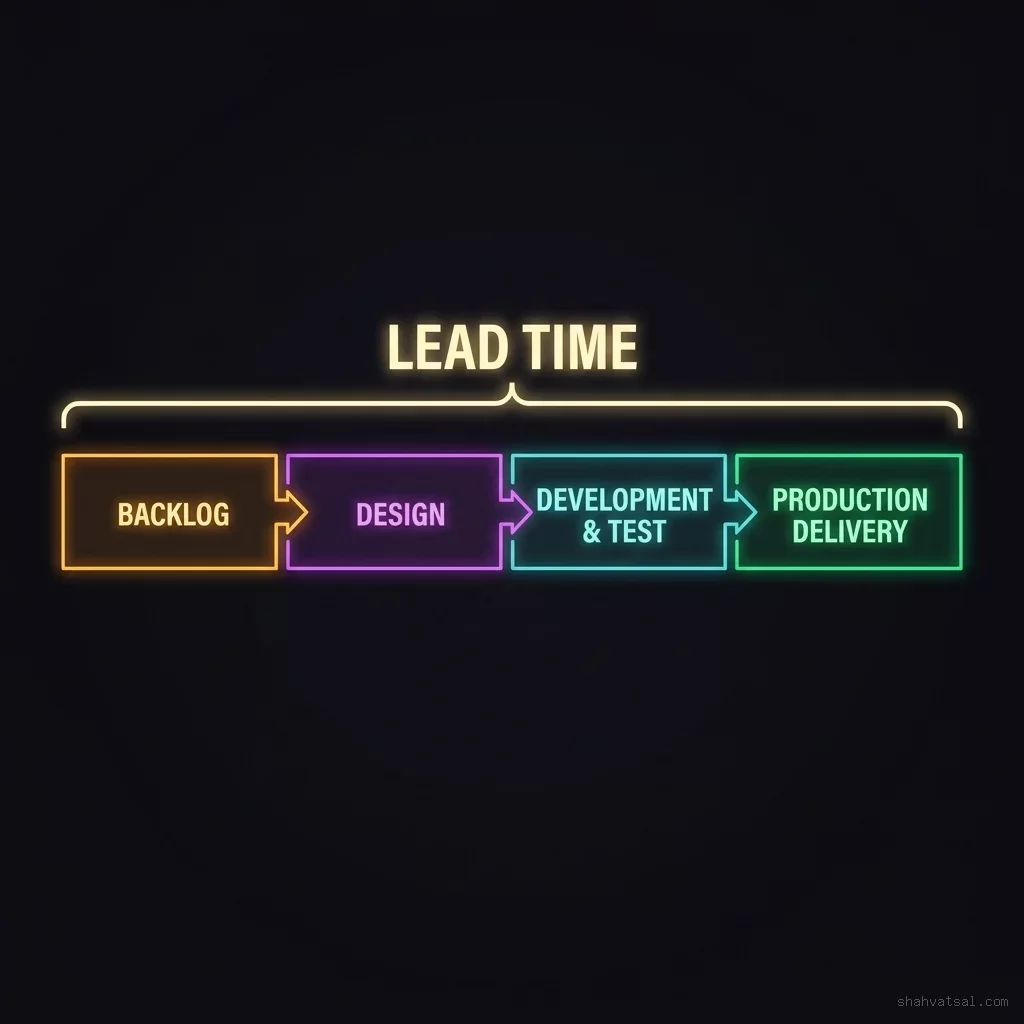
While Cycle Time focuses on the engineering team's efficiency, Lead Time tracks the entire lifecycle of a customer request. It starts the moment a request is created in the backlog (or when a customer submits a ticket) and ends when the solution is delivered to production.
Lead time is the metric that matters most to your customers. They do not care how fast your developers write code (Cycle Time); they care how long they have to wait for their requests to be fulfilled (Lead Time).
The Customer Perspective: Backlog Wait Times
In many organizations, the gap between lead time and cycle time is massive. A feature might have a cycle time of 3 days, but a lead time of 90 days. This means the feature sat in the product backlog or design queue for 87 days before an engineer ever looked at it.
Measuring lead time forces product and engineering leadership to collaborate on the end-to-end value stream. It highlights bottlenecks in the product discovery, design, and prioritization phases. An engineering team that is pushed to write code faster to optimize cycle time will achieve nothing if the upstream product management bottleneck is not cleared.
Calculating Flow Efficiency
Flow Efficiency is the ratio of active work time to total elapsed time:
$$\text{Flow Efficiency} = \frac{\text{Cycle Time}}{\text{Lead Time}} \times 100$$
For most enterprise software teams, flow efficiency is shockingly low—frequently between 5% and 15%. This means that for 85% to 95% of a ticket's life, nothing is happening to it; it is simply waiting in a queue.
Optimizing flow efficiency is the fastest, lowest-cost way to speed up software delivery. It does not require hiring more developers or forcing the current team to work longer hours. It simply requires removing the queues and handoff delays that keep work sitting idle.
WIP Limits: The Mathematical Engine of Flow Efficiency
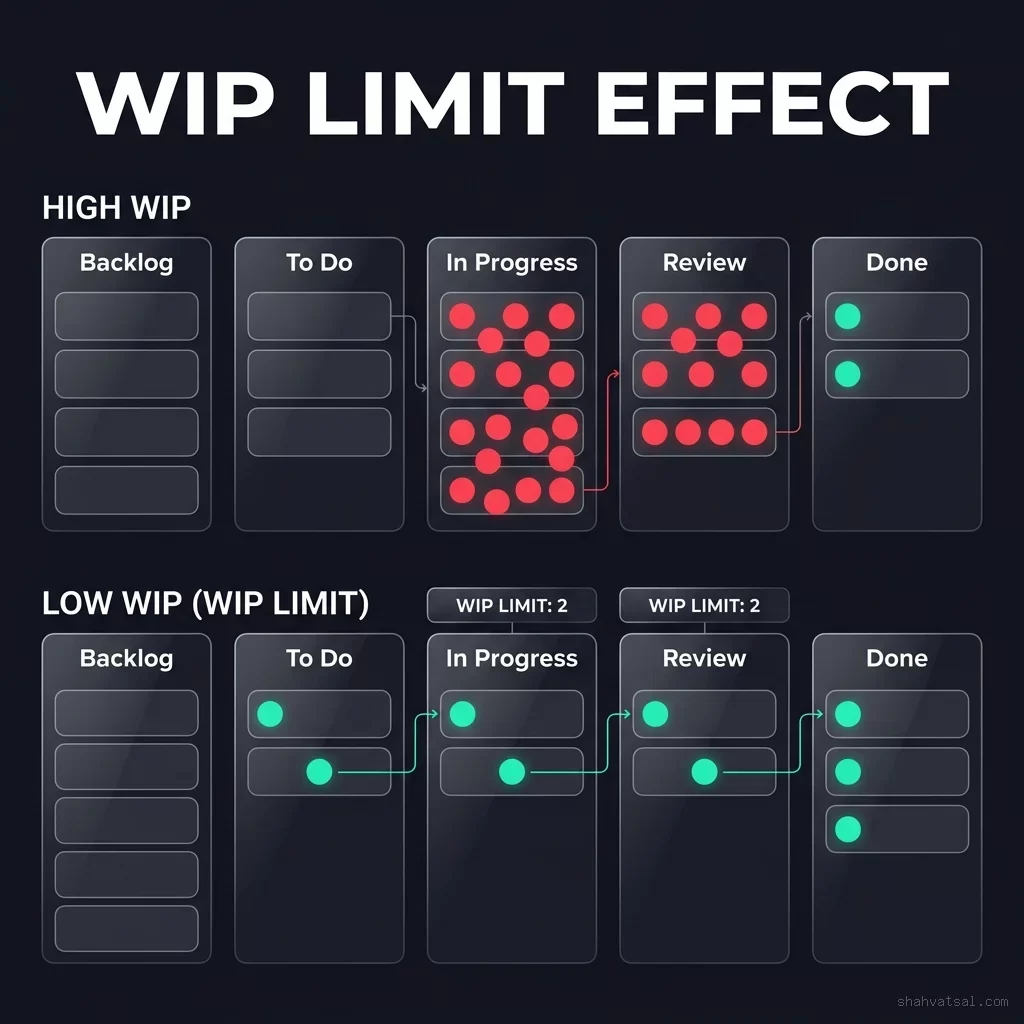
If cycle time, throughput, and lead time are the diagnostic indicators of your delivery pipeline, WIP limits are the steering wheel. A Work in Progress (WIP) limit is a strict rule that restricts the maximum number of work items allowed in a specific state at one time.
WIP limits are not a management constraint designed to restrict developers; they are a mathematical necessity for maintaining flow efficiency.
Context Switching: The Silent Productivity Killer
When an engineer is forced to switch between tasks, they pay a cognitive penalty. Research shows that context-switching between two active projects consumes 20% of a developer's cognitive capacity. Switching between three projects consumes 40%, and switching between five projects consumes 80%.
When a team has no WIP limits, developers naturally accumulate multiple active tasks. When blocked on a code review, they start a new ticket. When blocked on a database migration, they start another. Soon, every developer is juggling four to five tickets, progress slows to a crawl, and cycle times balloon.
By enforcing a WIP limit (e.g., a maximum of 1 active ticket per developer), we force a change in behavior: Stop Starting, Start Finishing. If a developer is blocked, they are incentivized to help a teammate unblock their work or perform a code review rather than starting a new task.
Designing and Implementing WIP Limits
WIP limits should be applied to individual stages of your Kanban board (e.g., Development, Review, Testing) rather than just the team as a whole. A practical starting point is:
$$\text{WIP Limit} = (\text{Number of Developers} \times 1.5)$$
For a team of 6 developers, a total In-Progress WIP limit of 9 is a reasonable baseline. If the "Review" column has a limit of 2, and 2 pull requests are already waiting for review, no new tickets can be moved from Development to Review until one of the existing PRs is approved. This immediately focuses the team's attention on clearing the review bottleneck.
Monte Carlo Forecasting: Predictable Scheduling Without Estimation
The ultimate benefit of transitioning from story points to flow metrics is the ability to perform Monte Carlo forecasting.
In a traditional story-point framework, scheduling is deterministic: we add up the estimated story points of the backlog, divide by the average sprint velocity, and calculate a single delivery date. This approach is highly fragile because it assumes that every estimate is correct and that velocity is constant.
Monte Carlo forecasting, by contrast, is probabilistic. It uses your team's historical throughput data to run thousands of computer simulations of your future delivery cycle, producing a probability distribution of delivery dates.
Running a Monte Carlo Simulation
To forecast a project timeline using Monte Carlo simulation, you need only two inputs:
- The number of items remaining in the backlog (as a range: e.g., 40 to 50 items).
- The team's historical daily throughput data over the last 30 to 90 days.
The output is not a single date, but a histogram of probabilities:
- 50% Probability: The project is completed by October 1st (50% of simulations finished on or before this date).
- 85% Probability: The project is completed by October 15th (85% of simulations finished on or before this date).
- 95% Probability: The project is completed by November 1st (95% of simulations finished on or before this date).
Comparison Table: Story Points vs. Flow Metrics
To summarize the shift in operational philosophy, let us compare the characteristics of story points and flow metrics across key project dimensions.
| Dimension | Story Points (Legacy Agile) | Flow Metrics (Modern Lean) |
|---|---|---|
| Data Source | Subjective team estimation poker sessions | Objective transition timestamps from tool metadata |
| Core Focus | Effort and complexity proxy metrics | Actual value delivery and cycle velocity |
| Manipulation Vector | Estimates can be inflated to artificially raise velocity | Cannot be gamed; a ticket is either shipped or In Progress |
| Planning Tool | Deterministic velocity math (Total Points / Velocity) | Probabilistic Monte Carlo simulations (empirical) |
| Team Incentive | Maximize output volume (activity reporting) | Limit WIP and clear pipeline bottlenecks (outcomes) |
| Context Switching | Often ignored in planning (capacity focused) | Actively minimized via strict WIP limits |
Pitfalls and Anti-Patterns in Flow Implementations
Transitioning to flow metrics is conceptually simple, but it requires breaking deep-seated habits. Watch out for these three common implementation pitfalls:
Pitfall 1: Letting Blocked Tickets Linger In-Progress
A common anti-pattern in teams moving to flow metrics is leaving blocked tickets in the "In Progress" column while starting new work. This keeps the active WIP high, violates Little's Law, and distorts cycle time data.
If a task is blocked by external dependencies (e.g., waiting for vendor approval), it should be moved to a designated "Blocked" column with its WIP limit, or returned to the Backlog. The cycle time clock should continue to run for blocked items to ensure that the cost of delay is visible to the entire organization.
Pitfall 2: Neglecting Work Item Splitting
If a team attempts to track throughput without learning to split work items into small, vertical slices, they will experience volatile delivery cycles. A single massive ticket that takes 4 weeks to complete will record a throughput of zero for three weeks, followed by one.
Engineering coaches must work with product managers to ensure that every ticket entering the active column represents a task that can be completed in 2 to 3 days. If a feature is larger than that, it is an epic and must be decomposed.
Pitfall 3: Using Flow Metrics for Individual Performance Evaluation
Perhaps the most destructive anti-pattern is using Cycle Time or Throughput to evaluate individual developers. Flow metrics are system performance indicators, not individual productivity scores.
If developers are evaluated on their individual cycle times, they will refuse to help colleagues, ignore code reviews, and skip architectural refactoring in favor of quick fixes. The team's overall flow efficiency will drop, even if individual metrics look clean. Keep the focus entirely on team-level delivery performance.
Futuristic Horizon: AI-Native Flow Orchestration 2027-2030
As we look toward the end of the decade, the integration of autonomous AI agents into the software delivery pipeline will transform how we manage flow. In 2026, humans still coordinate handoffs, review pull requests, and resolve pipeline blocks. By 2028, these coordination steps will be automated by AI-native flow orchestrators.
Autonomous Queue Management and Dynamic Routing
In an AI-native engineering pipeline, the flow orchestrator will monitor Cumulative Flow Diagrams in real time. If a bottleneck begins to form in the "Code Review" stage, the orchestrator will automatically reassign autonomous verification agents to review pending pull requests, clearing the block without human intervention.
Similarly, WIP limits will become dynamic. Instead of static numbers, the orchestrator will adjust WIP limits programmatically based on the team's live context-switching cognitive load and current pipeline health.
Predictive Risk Mitigation and Auto-Correction
Future flow tools will not just report historical cycle times; they will predict them for active work. If an agentic system detects that a developer has been working on a complex refactoring branch for longer than the 85th percentile cycle time, it will automatically analyze the codebase, identify the block, and draft a pull request to resolve it.
This shift will mark the transition from diagnostic project management to self-healing engineering systems. Teams will no longer focus on tracking delivery velocity; they will design the systems that automate it.
Key Takeaways
- Story Points measure effort, not outcomes: Velocity metrics are highly subjective, prone to inflation, and encourage code volume over system quality.
- Cycle Time is your delivery engine's health check: Track the time from development start to production deploy to identify bottleneck stages in your inner loop.
- Throughput is a reliable, gaming-proof metric: By measuring completed items per week, throughput rewards work item splitting and continuous delivery.
- WIP limits enforce flow efficiency: Limiting the amount of active work in progress minimizes context switching and accelerates cycle times.
- Monte Carlo forecasting removes estimation guessing: Probabilistic planning using historical throughput provides reliable, confidence-mapped delivery timelines.
- Flow metrics are team diagnostics: Never use cycle times to grade individual engineers; keep the focus on optimizing system throughput.
About the Author
Vatsal Shah is an AI Solutions Architect, Lean Delivery practitioner, and Engineering Leadership consultant. He specializes in helps scaling technology organizations deprecate estimation-heavy agile frameworks and transition to automated, empirical flow metrics, improving delivery speed and predictability across enterprise software pipelines.