STRATEGIC OVERVIEW Modern enterprise engineering organizations face an unprecedented crisis of resource fragmentation. Modern enterprise engineering organizatio…
Modern enterprise engineering organizations face an unprecedented crisis of resource fragmentation. As companies rapidly integrate artificial intelligence, cloud-native transformations, and security compliance mandates, the traditional Project Management Office (PMO) has become a severe bottleneck. Decisions regarding which initiatives to fund, which to put on hold, and how to allocate engineering capacity are still largely guided by subjective spreadsheets, political advocacy, and historical budget structures.
In the fast-moving tech environment of 2026, manual, human-centric portfolio management is no longer sustainable. Leading enterprises are shifting toward algorithmic capital allocation engines—automated data platforms that ingest real-time engineering metrics, market signals, and strategic objectives to determine the optimal distribution of capital and headcount. By replacing subjective reviews with quantitative optimization models, organizations can bridge the gap between corporate strategy and engineering execution.
This guide provides a comprehensive technical blueprint for software architects, engineering leaders, and Chief Technology Officers (CTOs) to design, build, and deploy an automated, AI-powered portfolio management decision engine. We will explore data ingestion structures, linear programming optimization models, dynamic audit pathways, and a pragmatic action plan to start implementation immediately.
Furthermore, as organizations transition toward autonomous developer agents and self-healing infrastructure, the speed of software delivery has multiplied. In an environment where code can be generated, tested, and deployed in minutes by automated workflows, waiting for quarterly business reviews to redirect capital or reallocate headcount becomes a critical strategic vulnerability. Algorithmic governance enables the organization's resource allocation layer to keep pace with its rapid execution capabilities.
By implementing these automated pipelines, enterprise decision-makers can ensure that capital is continuously directed to high-value opportunities, while eliminating the coordination overhead and reporting latency that historically paralyzed large-scale PMO departments. We will lay out the mathematical foundations and architectural requirements to construct this capability from the ground up.

1. PMO Decisions: The Bottleneck of Manual Portfolio Evaluation
Traditional portfolio management relies on periodic reviews—typically quarterly or annually—where project leads pitch their initiatives to executive committees. This approach suffers from several structural flaws:
Subjective Advocacy and Political Bias
Projects are frequently funded not on their objective merits, but on the political influence of their sponsors. High-performing managers are often skilled at crafting persuasive slides, while critical infrastructure work (such as technical debt reduction, system performance optimization, and architectural refactoring) is deprioritized because it lacks a flashy user interface.Information Latency
By the time a manual project scorecard is compiled, reviewed, and approved, the underlying data is already out of date. If a project experiences a developer attrition spike or a major architectural dependency block in week two of a quarter, leadership may not discover the impact until the end-of-quarter review. This latency wastes valuable engineering capacity on initiatives that are already off-track.Disconnect from Real Telemetry
Manual PMO trackers exist in a silo, completely separated from actual development tools. There is rarely a direct connection between the budget allocated to a project and the actual development telemetry (such as GitHub commits, Jira ticket cycle times, SRE error budgets, or AWS infrastructure costs). As a result, executives lack visibility into the true cost of delivery and the actual value created.To resolve these challenges, organizations need a centralized decision hub that integrates data across the business, engineering, and financial layers. The objective is to replace static reporting with a continuous, dynamic evaluation pipeline.
2. The Historical Context: From Gantt Charts to Algorithmic Governance
Project portfolio management has evolved through several key phases over the last century. Understanding this trajectory is crucial to seeing why algorithmic governance in 2026 is the logical next step:
[Phase 1: 1960s-1980s] -> [Phase 2: 1990s-2000s] -> [Phase 3: 2010s-2020s] -> [Phase 4: 2026+]
  Waterfall / Gantt        Agile / SAFe / OKRs      FinOps / Cloud Scale      Algorithmic Engines
Phase 1: The Waterfall Era (1960s–1980s)
Originating in heavy manufacturing and defense contracting, this era relied on rigid Gantt charts. Project managers assumed that timelines, requirements, and resource availability could be fully predicted years in advance. While highly structured, this model was completely unable to handle the rapid feedback loops of modern software engineering.Phase 2: The Agile and OKR Era (1990s–2000s)
The introduction of Scrum, Extreme Programming (XP), and eventually the Scaled Agile Framework (SAFe) recognized that software development is an iterative process. Organizations shifted toward Objective and Key Results (OKRs) to align teams. However, while teams became agile, the PMO layer remained waterfall-centric, reviewing allocations on annual or quarterly cycles and relying on self-reported spreadsheets.Phase 3: The FinOps and Cloud-Native Era (2010s–2020s)
As systems moved to public clouds, infrastructure spend shifted from Capital Expenditure (CapEx) to Operational Expenditure (OpEx). FinOps teams emerged to optimize cloud bills, matching infrastructure usage to business value metrics. However, these systems remained retrospective—reporting what had already been spent rather than dynamically optimization allocation vectors for future tasks.Phase 4: The Algorithmic Era (2026+)
With the rise of autonomous AI systems, organizations are merging operations research, developer telemetry, and real-time strategic priorities. The PMO is transformed from a reporting team into a software platform that matches available capacity to strategic goals. This approach enables organizations to run automated simulation trials and evaluate hundreds of resource configurations in seconds.3. Algorithmic Evaluation: Standardizing Project Scorecards with AI Data Anchors
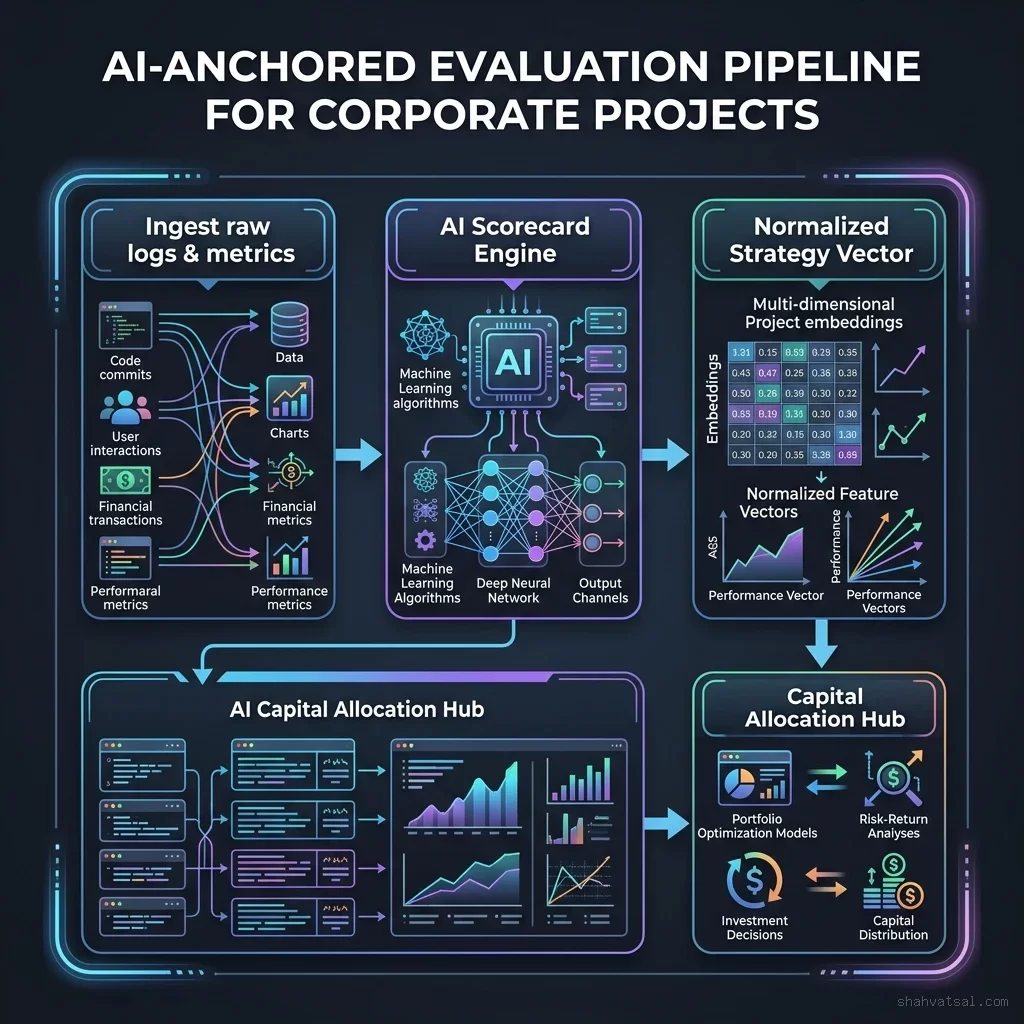
An algorithmic capital allocation engine requires a standardized, quantitative scorecard for every project in the corporate catalog. Instead of relying on manual surveys filled out by managers, the engine should dynamically pull data from live operational tools.
We define three core classes of data anchors:
- Strategic Vector ($S$): Measures alignment with executive goals, including target market segments, security requirements, and core business objectives.
- Execution Health Vector ($E$): Measures development activity, pipeline stability, and delivery performance.
- Financial Efficiency Vector ($F$): Measures infrastructure spend, licensing costs, and overall ROI metrics.
Strategic Vector ($S$)
Strategic alignment is often the hardest metric to quantify. To standardize this factor, the engine translates high-level corporate goals into a normalized vector. For example, if the company's primary goals for 2026 are:- $G_1$ (Efficiency / Margin Expansion): Weight = 0.50
- $G_2$ (Market Expansion): Weight = 0.30
- $G_3$ (Security & Compliance): Weight = 0.20
$$S_p = 0.50 \cdot S_{p, G_1} + 0.30 \cdot S_{p, G_2} + 0.20 \cdot S_{p, G_3}$$
This ensures that the strategic score dynamically updates as corporate goals shift. For more details on aligning board goals with executive reporting, see our playbook on AI governance and board ROI reporting.
Execution Health Vector ($E$)
Execution health is determined by querying the developer toolchain:- Velocity Ratio ($V_r$): The ratio of completed story points to planned points in Jira.
- Defect Density ($D_d$): The number of critical bugs opened per 1,000 lines of code.
- Lead Time ($L_t$): The average time taken for a code change to move from initial commit to production.
- Churn Rate ($C_r$): The percentage of code modified or deleted within 21 days of being written.
$$E_p = w_v \cdot V_r - w_d \cdot D_d - w_l \cdot L_t - w_c \cdot C_r$$
Where $w_v, w_d, w_l,$ and $w_c$ are normalized weights defined by the engineering leadership team to reflect organizational priorities.
Financial Efficiency Vector ($F$)
The financial vector links engineering output with actual costs, drawing data directly from cloud cost management platforms (FinOps) and payroll databases:- Cloud Unit Cost ($C_u$): The infrastructure cost incurred per active user transaction.
- Resource Utilization ($U_r$): The average CPU/memory utilization of Kubernetes pods hosting the project services.
- FTE Cost ($C_f$): The direct cost of developer hours logged to the project's repository.
4. Mathematical Formulation: The Operations Research Model for Capital Allocation
To allocate capital algorithmically, we translate the resource management problem into a formal mathematical model. We choose Mixed-Integer Linear Programming (MILP) because it guarantees finding the globally optimal solution within our defined constraints, unlike heuristic search approaches (such as genetic algorithms) which can get stuck in local optima.
Objective Function
Our objective is to maximize the overall value of the portfolio. The utility value of each project is a function of its composite score ($Score_p$) and the capacity level ($y_p$) at which it is funded. We write this objective function as:$$\text{Maximize } Z = \sum_{p \in P} Score_p \cdot y_p \cdot x_p$$
Where:
- $x_p \in \{0, 1\}$ is a binary decision variable indicating whether project $p$ is funded ($x_p=1$) or rejected ($x_p=0$).
- $y_p \in [L_p, U_p]$ is a continuous decision variable representing the capacity allocation level (scaling factor) assigned to the project.
- $Score_p$ is the composite scorecard result: $Score_p = \alpha S_p + \beta E_p + \gamma F_p$, where $\alpha + \beta + \gamma = 1.0$.
Formulation Constraints
1. Capital Budget Limit
The total financial expenditure of the portfolio cannot exceed the allocated corporate capital pool ($B$):$$\sum_{p \in P} (Cost_p^{\text{fixed}} \cdot x_p + Cost_p^{\text{variable}} \cdot y_p) \le B$$
Here, we split the project cost into a fixed cost (e.g., initial software licenses, base server hosting) and a variable cost (e.g., developer salaries, scaling cloud resources).
2. Headcount Availability
Engineering resources are divided into distinct pools (e.g., Frontend, Backend, SRE, Data Science). For each pool $k$, the allocated developer headcount across all funded projects must not exceed the available capacity $C_k$:$$\sum_{p \in P} R_{p, k} \cdot y_p \cdot x_p \le C_k \quad \forall k$$
Where $R_{p, k}$ is the base headcount requirement of resource pool $k$ for project $p$.
3. Capacity Boundary (The MVP Constraint)
A project cannot function if it is underfunded below its Minimum Viable Product (MVP) team size. Similarly, adding too many developers to a project introduces coordination overhead and diminishing returns (Brooks' Law). We enforce these boundaries with:$$L_p \cdot x_p \le y_p \le U_p \cdot x_p \quad \forall p \in P$$
Where:
- $L_p$ is the minimum operational scaling factor (e.g., $0.40$ or 40% capacity).
- $U_p$ is the maximum operational scaling factor (e.g., $1.00$ or 100% capacity).
4. Project Dependency and Mutual Exclusion Constraints
In a real enterprise, projects do not exist in isolation. We must model architectural dependencies:- Dependency Constraint: If project $A$ requires project $B$ to be funded first:
- Mutual Exclusion Constraint: If project $C$ and project $D$ are competing approaches and only one can be funded:
5. The Operations Research Science: Deep-Dive into MILP Complexity
Mixed-Integer Linear Programming is a branch of operations research dealing with problems where some variables are constrained to be integers (such as our binary selection variable $x_p \in \{0,1\}$) while others are continuous (such as capacity scale $y_p \in [0.4, 1.0]$).
While linear programming problems without integers can be solved in polynomial time (using algorithms like the Simplex method or Interior Point methods), the addition of integer constraints makes the problem NP-hard. This means that as the number of projects scales, the search space grows exponentially.
To solve this efficiently, modern solvers (such as COIN-OR CBC, GLPK, or Gurobi) use a combination of:
Branch-and-Bound Algorithm
The solver first solves the "relaxed" problem where integer variables are treated as continuous (e.g., allowing $x_p$ to be 0.73). If the relaxed solution does not satisfy integer constraints, the solver splits the problem into sub-problems (branches), setting $x_p = 0$ in one branch and $x_p = 1$ in the other, and recursively bounds the maximum possible value.Cutting Plane Methods
The solver adds new linear constraints (cuts) that prune away fractional solutions without removing any valid integer points. This tightens the relaxed search space, accelerating convergence.Presolve Routines
Before running the solver, the engine simplifies the model by analyzing dependencies. For example, if project $A$ requires project $B$, and project $B$ is excluded due to budget limits, the solver immediately excludes project $A$ without executing branches.6. Jira and Cloud Telemetry: The Ingestion Engine Architecture
To drive the scoring vectors, the engine requires a reliable, event-driven ingestion pipeline. The system pulls metrics from development logs, ticket platforms, and cloud billings.
System Data Flow Pipeline
  +--------------+       +-------------------+       +-----------------------+
  |  Jira API    | ----> | Ingestion Service | ----> | PostgreSQL Database   |
  +--------------+       +-------------------+       +-----------------------+
                                  ^                  | - raw metrics         |
  +--------------+                |                  | - strategic mappings  |
  |  Cloud Bills | ---------------|                  +-----------------------+
  +--------------+                                               |
                                                                 v
                                                     +-----------------------+
                                                     |  Python MILP Solver   |
                                                     +-----------------------+
                                                                 |
                                                                 v
                                                     +-----------------------+
                                                     | Dashboard & Proposals |
                                                     +-----------------------+
Ingestion Metric Calculations
- Velocity Ratio ($V_r$): The service aggregates the sum of completed story points (
customfield_10016when status isDone) and divides by the committed points. - Lead Time ($L_t$): Calculated by comparing the
resolutiondatetimestamp with the changelog timestamp indicating the shift fromTo DotoIn Progress.
7. The Python Ingestion Service Code Walkthrough
To demonstrate how the ingestion service is built, we provide a complete Python implementation below that queries the Jira API, extracts task metrics, and saves them to our database.
import os
import requests
import psycopg2
from datetime import datetime

class JiraIngestionService:
    def __init__(self):
        self.jira_url = os.getenv("JIRA_URL", "https://enterprise.atlassian.net/rest/api/3")
        self.jira_user = os.getenv("JIRA_USER")
        self.jira_token = os.getenv("JIRA_TOKEN")
        self.db_conn = psycopg2.connect(os.getenv("DATABASE_URL"))

    def fetch_recent_tickets(self, project_key):
        """Query Jira JQL for issues updated in the last 30 days."""
        headers = {"Accept": "application/json"}
        auth = (self.jira_user, self.jira_token)
        jql = f"project = {project_key} AND updated >= -30d"

        response = requests.get(
            f"{self.jira_url}/search",
            params={"jql": jql, "fields": "summary,status,customfield_10016,resolutiondate,created", "expand": "changelog"},
            headers=headers,
            auth=auth
        )
        if response.status_code != 200:
            raise RuntimeError(f"Jira query failed: {response.text}")
        return response.json().get("issues", [])

    def parse_and_save(self, project_id, issues):
        """Parse Jira payloads to compute metrics and upsert database rows."""
        cursor = self.db_conn.cursor()
        for issue in issues:
            key = issue["key"]
            fields = issue["fields"]
            status = fields["status"]["name"]
            points = fields.get("customfield_10016") or 0.0

            created_dt = datetime.strptime(fields["created"][:19], "%Y-%m-%dT%H:%M:%S")
            resolved_dt = None
            if fields.get("resolutiondate"):
                resolved_dt = datetime.strptime(fields["resolutiondate"][:19], "%Y-%m-%dT%H:%M:%S")

            # Find when issue entered in-progress status from changelog histories
            in_progress_dt = None
            for history in issue.get("changelog", {}).get("histories", []):
                for item in history.get("items", []):
                    if item.get("field") == "status" and item.get("toString") == "In Progress":
                        in_progress_dt = datetime.strptime(history["created"][:19], "%Y-%m-%dT%H:%M:%S")
                        break

            # Upsert into raw_jira_tickets table
            cursor.execute("""
                INSERT INTO raw_jira_tickets (id, project_id, status, story_points, created_date, in_progress_date, resolution_date)
                VALUES (%s, %s, %s, %s, %s, %s, %s)
                ON CONFLICT (id) DO UPDATE SET
                    status = EXCLUDED.status,
                    story_points = EXCLUDED.story_points,
                    in_progress_date = COALESCE(EXCLUDED.in_progress_date, raw_jira_tickets.in_progress_date),
                    resolution_date = EXCLUDED.resolution_date
            """, (key, project_id, status, points, created_dt, in_progress_dt, resolved_dt))

        self.db_conn.commit()
        cursor.close()

    def run(self, project_id, project_key):
        print(f"Starting Jira ingestion for {project_key}...")
        issues = self.fetch_recent_tickets(project_key)
        self.parse_and_save(project_id, issues)
        print(f"Ingested {len(issues)} issues successfully.")
8. Optimization Models: Balancing Dev Bandwidth against Business ROI Goals
Once the project scorecards are standardized, the engine runs an optimization model to allocate capital and headcount. Rather than funding projects in a simple linear list until the budget runs out, we must solve a multi-variable constraint problem.
We model this as a Mixed-Integer Linear Programming (MILP) optimization problem.

Visualizing Resource Allocation
To help engineering managers balance resources, the decision engine renders a live headcount matrix mapping available capacity against project demands: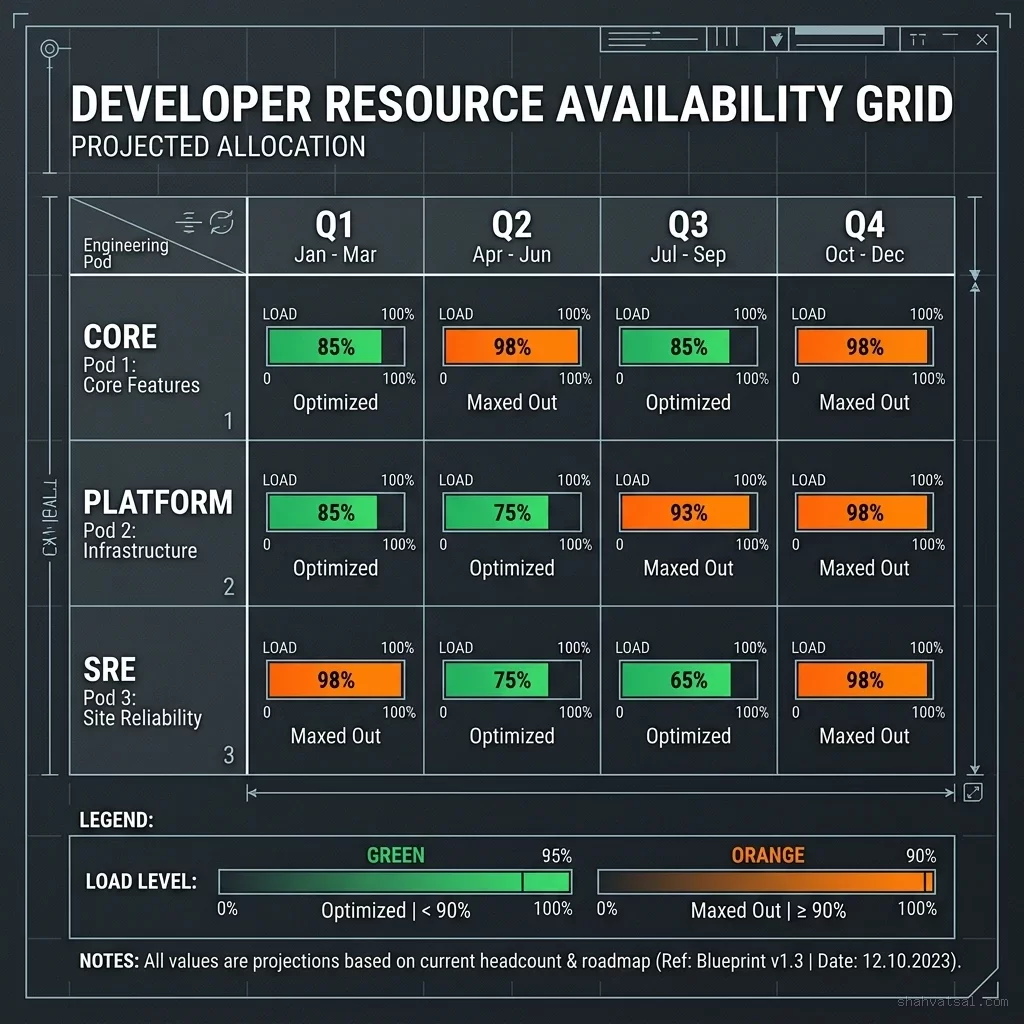
9. Detailed Case Study: A Sample Run of Five Enterprise Projects
To see the optimization model in action, let's look at a concrete case study involving a portfolio of 5 projects competing for a total budget of $1.5M and a developer capacity limit of 10 Frontend engineers and 12 Backend engineers.
Project Inventory Parameters
| Project ID | Project Name | Cost ($) | Composite Score | Frontend Required | Backend Required | Min Bound ($L_p$) | Max Bound ($U_p$) |
|---|---|---|---|---|---|---|---|
P_ERP | Core ERP Migration | 600,000 | 9.2 | 2 | 5 | 0.80 | 1.00 |
P_REC | AI Recommender Engine | 500,000 | 8.8 | 4 | 4 | 0.50 | 1.00 |
P_SEC | Security & Compliance | 300,000 | 9.5 | 1 | 3 | 1.00 | 1.00 |
P_DEV | Developer Platform | 400,000 | 7.5 | 3 | 2 | 0.40 | 0.80 |
P_BOT | Customer Chatbot | 350,000 | 6.8 | 3 | 3 | 0.50 | 1.00 |
Dependency Rule
P_REC(AI Recommender) requiresP_ERP(Core ERP Migration) to be funded (due to database integrations): $x_{\text{REC}} \le x_{\text{ERP}}$.
Running the Optimization Solver
When we input these parameters into our MILP solver, it evaluates the resource limits:- Total Budget limit = $1,500,000
- Frontend limit = 10
- Backend limit = 12
P_SEC(Security & Compliance): Funded ($x=1.0$), Capacity Scale = 1.00 (Cost = $300k, Frontend = 1, Backend = 3).P_ERP(Core ERP Migration): Funded ($x=1.0$), Capacity Scale = 0.80 (Cost = $480k, Frontend = 1.6, Backend = 4).P_REC(AI Recommender): Funded ($x=1.0$), Capacity Scale = 0.60 (Cost = $300k, Frontend = 2.4, Backend = 2.4).P_DEV(Developer Platform): Funded ($x=1.0$), Capacity Scale = 0.50 (Cost = $200k, Frontend = 1.5, Backend = 1).P_BOT(Customer Chatbot): Rejected ($x=0.0$), Capacity Scale = 0.00 (Cost = $0).
Result Summary
- Total cost spent: $1,280,000 (Remaining budget cushion: $220k).
- Frontend developers used: 6.5 / 10.0.
- Backend developers used: 10.4 / 12.0.
- Total Portfolio Value Score: $18.39.
10. Database Schema and SQL Queries for Metric Extraction
To help database engineers and system architects construct the platform, we outline the primary database schemas below.
Database Tables (PostgreSQL DDL)
-- 1. Project Master Catalog
CREATE TABLE projects (
    id VARCHAR(50) PRIMARY KEY,
    name VARCHAR(255) NOT NULL,
    description TEXT,
    owner_email VARCHAR(255) NOT NULL,
    cost_estimate NUMERIC(12, 2) NOT NULL,
    min_capacity_bound NUMERIC(3, 2) DEFAULT 0.40,
    max_capacity_bound NUMERIC(3, 2) DEFAULT 1.00,
    created_at TIMESTAMP WITH TIME ZONE DEFAULT CURRENT_TIMESTAMP,
    updated_at TIMESTAMP WITH TIME ZONE DEFAULT CURRENT_TIMESTAMP
);

-- 2. Strategic Goal Weights
CREATE TABLE strategic_goals (
    id VARCHAR(50) PRIMARY KEY,
    name VARCHAR(255) NOT NULL,
    target_weight NUMERIC(3, 2) NOT NULL,
    description TEXT,
    last_updated TIMESTAMP WITH TIME ZONE DEFAULT CURRENT_TIMESTAMP
);

-- 3. Project Scoring Vectors (Dynamic Cache)
CREATE TABLE project_scores (
    project_id VARCHAR(50) REFERENCES projects(id) ON DELETE CASCADE,
    strategic_score NUMERIC(4, 2) NOT NULL,
    execution_score NUMERIC(4, 2) NOT NULL,
    financial_score NUMERIC(4, 2) NOT NULL,
    composite_score NUMERIC(4, 2) GENERATED ALWAYS AS (
        (strategic_score * 0.50) + (execution_score * 0.30) + (financial_score * 0.20)
    ) STORED,
    last_evaluated_at TIMESTAMP WITH TIME ZONE DEFAULT CURRENT_TIMESTAMP,
    PRIMARY KEY (project_id)
);

-- 4. Headcount Capacity Requirements
CREATE TABLE project_resource_requirements (
    project_id VARCHAR(50) REFERENCES projects(id) ON DELETE CASCADE,
    resource_pool VARCHAR(50) NOT NULL, -- e.g., 'frontend', 'backend', 'sre'
    headcount_required INT NOT NULL,
    PRIMARY KEY (project_id, resource_pool)
);

-- 5. Allocation Audit Log
CREATE TABLE allocation_proposals (
    id SERIAL PRIMARY KEY,
    proposed_by VARCHAR(255) NOT NULL,
    proposal_data JSONB NOT NULL, -- Contains JSON object map of {project_id: {funded: bool, capacity: float}}
    net_value_delta NUMERIC(8, 2) NOT NULL,
    status VARCHAR(20) DEFAULT 'pending', -- 'pending', 'approved', 'rejected'
    created_at TIMESTAMP WITH TIME ZONE DEFAULT CURRENT_TIMESTAMP,
    reviewed_at TIMESTAMP WITH TIME ZONE
);
SQL Query: Extracting Dynamic Velocity and Lead Times
The following query aggregates raw developer ticket metrics from the ingestion schema to calculate the execution health inputs for the scorecard engine:WITH ticket_metrics AS (
SELECT
project_id,
COUNT(id) AS total_tickets,
SUM(CASE WHEN status = 'Done' THEN story_points ELSE 0 END) AS completed_points,
SUM(story_points) AS total_points,
AVG(EXTRACT(EPOCH FROM (resolution_date - in_progress_date)) / 86400.0) AS avg_lead_time_days
FROM raw_jira_tickets
WHERE created_date >= NOW() - INTERVAL '30 days'
GROUP BY project_id
)
SELECT
p.id AS project_id,
p.name AS project_name,
COALESCE(tm.completed_points / NULLIF(tm.total_points, 0), 0.0) AS velocity_ratio,
COALESCE(tm.avg_lead_time_days, 14.0) AS avg_lead_time_days,
-- Normalized execution score bounded between 0 and 10
LEAST(GREATEST(
(COALESCE(tm.completed_points / NULLIF(tm.total_points, 0), 0.0) * 10) -
(COALESCE(tm.avg_lead_time_days, 14.0) * 0.2)
, 0.0), 10.0) AS calculated_execution_score
FROM projects p
LEFT JOIN ticket_metrics tm ON p.id = tm.project_id;11. Auditing the Strategy Bridge: Dynamic Recalculation as Market Goals Shift
Capital allocation is not a set-and-forget process. Enterprise priorities change rapidly due to competitive pressures, macroeconomic shifts, or technological milestones (such as the integration of a new semantic data layer like SAP's open Dremio lakehouse engine).
The engine maintains a strategy audit path to track modifications and trigger automatic recalculations:
When a corporate goal weight changes, the engine executes the following audit pipeline:
graph TD
    A["Corporate Goal Shift (e.g., Security Weight +20%)"] --> B["Recalculate Strategic Score (S_p)"]
    B --> C["Update Composite Project Scores"]
    C --> D["Execute MILP Solver"]
    D --> E{"Is Current Allocation Optimal?"}
    E -- Yes --> F["Maintain Staffing Levels"]
    E -- No --> G["Generate Reallocation Proposals"]
    G --> H["Trigger Stakeholder Alerts & Approval Workflow"]
Event-Driven Triggers
The engine listens to external events to prompt a recalculation review:- Execution Threshold Alert: A funded project's execution score $E_p$ drops below a critical threshold (e.g., cycle time increases by 50%).
- Cloud Budget Alert: SRE/FinOps telemetry signals that infrastructure costs have exceeded the projected threshold by 30%.
- Strategy Update: Executives modify goal weights via the administrative control panel.
Reallocation Proposals
Instead of dynamically shifting developers between projects overnight, the engine generates allocation proposals. These proposals outline the net benefit of moving headcount, calculating the expected change in total portfolio value:$$\Delta \text{Value} = \text{Score}{\text{Target}} \cdot \Delta y{\text{Target}} - \text{Score}{\text{Source}} \cdot \Delta y{\text{Source}}$$
This allows leadership to review and approve resource shifts before execution.
12. What to Do Monday Morning: 3 Steps to Build an Algorithmic Project Scoring Table
Transitioning to an algorithmic capital allocation model does not require a multi-million dollar software purchase. You can build a functioning version of the engine in a single week by following these three steps:
Step 1: Standardize the Project Inventory schema
Create a unified inventory table in your data platform (PostgreSQL, BigQuery, or Snowflake). Define the base schema including strategic goals, resource pool requirements, and actual spend targets as outlined in the schemas section.Step 2: Establish the Data Ingestion Pipelines
Write lightweight cron scripts or serverless tasks to pull execution and financial metrics:- Jira metrics: Query the Jira API to pull completed story points, epic counts, and blocked ticket rates.
- FinOps metrics: Extract cloud spend details from your cloud provider's cost billing tables.
- FTE costs: Pull time tracking log totals from payroll systems.
Step 3: Implement the Optimization Solver
Write a Python script using an open-source optimization library (such as PuLP or SciPy) to solve the MILP model. Load the project parameters from your database, run the solver, and output the optimized allocation values ($x_p$ and $y_p$) to a dashboard for leadership review.A basic Python solver implementation is shown below:
import pulp

def optimize_portfolio(projects, total_budget, dev_capacity):
    """
    Solves the Mixed-Integer Linear Programming problem for capital allocation.

    projects: dict of project parameters {id: {score, cost, frontend_devs, backend_devs}}
    total_budget: float
    dev_capacity: dict of available headcount {'frontend': int, 'backend': int}
    """
    # Create the MILP problem
    prob = pulp.LpProblem("Portfolio_Optimization", pulp.LpMaximize)

    # Define Decision Variables
    x = {p: pulp.LpVariable(f"x_{p}", cat="Binary") for p in projects}
    y = {p: pulp.LpVariable(f"y_{p}", lowBound=0.4, upBound=1.0) for p in projects}

    # Objective Function: Maximize weighted value
    prob += pulp.lpSum(projects[p]['score'] * y[p] for p in projects)

    # Constraint 1: Budget limit
    prob += pulp.lpSum(projects[p]['cost'] * y[p] * x[p] for p in projects) <= total_budget

    # Constraint 2: Frontend headcount limit
    prob += pulp.lpSum(projects[p]['frontend_devs'] * y[p] * x[p] for p in projects) <= dev_capacity['frontend']

    # Constraint 3: Backend headcount limit
    prob += pulp.lpSum(projects[p]['backend_devs'] * y[p] * x[p] for p in projects) <= dev_capacity['backend']

    # Solve the problem
    prob.solve()

    # Extract results
    allocation = {}
    for p in projects:
        is_funded = pulp.value(x[p]) == 1
        allocated_capacity = pulp.value(y[p]) if is_funded else 0.0
        allocation[p] = {
            "funded": is_funded,
            "capacity": allocated_capacity
        }
    return allocation
Strategic Alignment Tracker Visualization
The dashboard displays the alignment of the active budget against strategic goals, helping executives spot discrepancies between corporate strategy and engineering focus: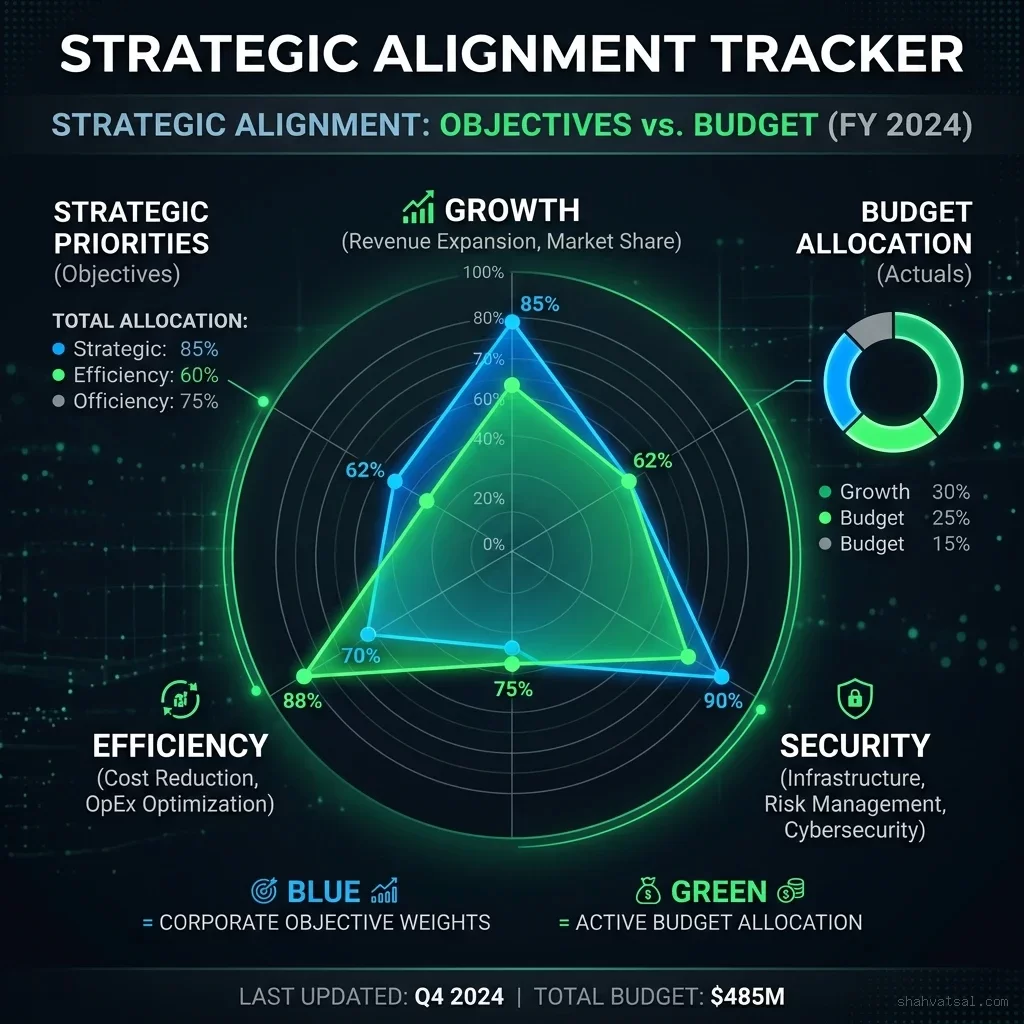
13. Frequently Asked Questions
How does this engine prevent political game-playing by team leads?
By sourcing metrics directly from development toolchains (e.g., Jira velocity, GitHub pull requests, SRE error budgets) rather than manual status updates, the engine anchors scorecards in objective execution telemetry.What is the minimum viable team size (minimum capacity bound)?
The minimum capacity bound ($L_p$) represents the smallest staffing level under which a project can operationalize. For example, a setting of $0.40$ ensures that if a project is funded, it receives at least 40% of its requested headcount, preventing teams from being split too thin to deliver.How does the engine integrate with corporate FinOps?
The engine pulls actual infrastructure costs per transaction from your cloud provider's billing tables. This is compared against the project's target unit cost to generate the financial efficiency score, penalizing inefficient code paths.Can the optimization engine support non-linear constraints?
Yes. While standard MILP solvers require linear formulations, more complex scenarios (such as step-cost increases or risk curve thresholds) can be resolved using quadratic programming or heuristic algorithms (such as genetic algorithms).How often should the optimization model be run?
The scoring vector is evaluated continuously as metrics update. However, to maintain organizational stability, the optimization solver is typically executed on a scheduled basis (e.g., bi-weekly or monthly) to generate reallocation proposals for review.What open-source solvers are recommended for running the MILP optimization model?
For most mid-sized portfolios (up to 1,000 active projects), open-source solvers like COIN-OR CBC or GLPK (via Python's PuLP library) execute in under a second. High-scale portfolios requiring complex non-linear structures or thousands of dependencies can scale to commercial solvers such as Gurobi or CPLEX.How are developer headcount requirements calculated dynamically?
Developer headcount requirements ($R_{p, k}$) are extracted by analyzing pull request histories, git branch logs, and time sheets from previous iterations. The allocation engine matches these requirements against real-time engineer skill tags to ensure balanced team distributions.Does the engine support dynamic risk adjustment?
Yes. The composite project score ($Score_p$) incorporates a variance penalty factor ($V_p$) to reduce allocations for high-risk, volatile projects during economic downturns, prioritizing stable, high-margin maintenance initiatives.What is the role of LLMs in the strategic evaluation layer?
LLMs evaluate project documentation (e.g., architecture designs, product briefs) against a vector database containing corporate goal statements. The engine calculates cosine similarity scores to generate the raw strategic score vector automatically.How do SRE error budgets map into execution health scorecards?
SRE metrics (such as SLA adherence and API error rate logs) are linked directly to specific application repositories. If a repository's error budget is exhausted, the system automatically lowers the project's execution score, flagging the need for increased maintenance resources.How are dependent projects linked mathematically?
Dependent projects are linked using precedence constraints. If Project B depends on Project A, we add the inequality constraint $x_B \le x_A$, ensuring that Project B cannot be funded ($x_B=1$) unless Project A is also funded ($x_A=1$).How does the engine handle fractional engineering capacity?
Fractional capacity is represented by the continuous decision variable $y_p$. A value of $0.60$ indicates that the project receives 60% of its requested team size, and the solver automatically scales down the frontend and backend headcount requirement vectors by that factor.14. Conclusion
The shift from manual, subjective portfolio planning to algorithmic capital allocation is a major milestone in enterprise operational maturity. By automating project scorecards, resolving resource scarcity with optimization algorithms, and establishing structured audit pathways, tech organizations can ensure that their engineering capacity is directly aligned with their highest-value corporate goals.
However, implementing an algorithmic decision engine is not merely a software challenge; it is a cultural transformation. Traditional PMO teams and line-of-business sponsors may initially resist the transition, viewing the algorithm as a threat to their autonomy or political influence. To overcome this inertia, leadership must establish transparent guidelines around how strategic goal weights are set, and clearly document that the solver generates "allocation proposals" rather than executing headcount changes silently in the background.
Furthermore, engineering teams must be trained on FinOps tools and telemetry-driven development. Developers should understand how their Jira updates and repository commits directly influence their project's scorecard metrics, encouraging better documentation, more accurate story point estimates, and higher-quality code outputs.
Start by cataloging your active initiatives, building basic Jira/FinOps data pipelines, and establishing a baseline scoring model. The savings in engineering efficiency and the reduction in wasted capital will immediately validate the investment, paving the way for a truly autonomous enterprise.