STRATEGIC OVERVIEW Every organization has a goal-setting ritual. Once a quarter, leaders gather to establish Objectives and Key Results (OKRs). Sheets are fille…
Every organization has a goal-setting ritual. Once a quarter, leaders gather to establish Objectives and Key Results (OKRs). Sheets are filled, dashboards are configured, and announcements are made.
Yet, by week four of the quarter, the "OKR Theater" takes over. Key results are abandoned, spreadsheets sit un-updated, and engineers lose track of how their daily commits align with corporate strategy. The check-in process becomes a retrospective justification exercise, where teams scramble to self-grade their progress at the end of the quarter.
In the fast-moving tech environment of 2026, leading organizations are replacing manual check-in theater with AI-driven OKR execution engines. By deploying autonomous agents that parse developer toolchains, commit logs, and jira tickets, companies can track goals in real-time, detect engineering blockers before they delay delivery, and programmatically grade key results. This connects executive objectives directly to operational telemetry.
This guide provides a complete technical blueprint to design, build, and deploy an automated, AI-powered OKR tracking engine. We will explore OKR hierarchy trees, real-time ingestion pipelines, automated grading algorithms, database DDLs, and blocker escalation flows.
1. The OKR Theater: Why Manual Goal Tracking Fails
Manual OKR tracking systems fail because they rely on human reporting, which introduces three major issues:
Reporting Bias and Safety Buffering
When updates are manual, teams tend to report optimistic progress early in the quarter, only to dump delays on leadership in the final weeks. This is a well-documented phenomenon in behavioral psychology known as "safety buffering" or the "watermelon effect"—where projects appear green on the outside but are deep red on the inside.Managers and developers naturally want to protect their standing and avoid micro-management. Consequently, they inflate initial confidence scores, hoping that a surge of productivity in weeks 8 to 12 will rescue the key results. When that surge fails to materialize, the project collapses. Furthermore, team leads often set sandbagged target values to ensure success, leading to inflated achievement scores that do not reflect true business outcomes or drive organizational growth.
Information Latency
A manual check-in is typically updated bi-weekly or monthly, often right before a leadership review. If an engineering blocker (such as an architectural dependency, API contract drift, or an unresolved merge conflict in a core service) stalls development in week three, leadership may not discover the delay until week six or seven.By the time the issue is flagged on a manual status report, three to four weeks of developer velocity have been wasted on blocked tasks. The cost of this latency is not just the delayed feature itself; it is the compound interest of delayed decisions across the entire product portfolio. In modern software engineering, a delay of two weeks in a core platform API can derail downstream product teams, leading to missed launch windows and lost market opportunity.
Cognitive Overhead
Filling out trackers, preparing slides, and attending alignment syncs takes time away from actual engineering. Developers view OKRs as administrative overhead rather than a tool to guide daily decisions. When goal check-ins are manual, they require developers to switch context from their IDEs to spreadsheet tools, write qualitative descriptions of their work, and translate code contributions into arbitrary progress percentages.This administrative friction translates directly into lost developer hours. If an engineering organization of 500 developers spends just one hour per week on manual OKR check-ins and alignment meetings, the company loses 26,000 engineering hours annually. That is the equivalent of losing a dedicated engineering squad of 13 full-time developers to pure administrative overhead.
The Goodhart's Law Trap
When manual OKRs are tied to performance reviews or compensation, teams begin to gamify the metrics. Goodhart's Law states: "When a measure becomes a target, it ceases to be a good measure." In manual systems, teams optimize for the metric itself rather than the underlying business value.For instance, if a key result is to "reduce technical debt by resolving 100 Jira bugs," developers might focus on low-impact, cosmetic bugs rather than high-severity architectural issues. The manual tracking system registers a 100% completion rate, but the system stability remains unchanged. An autonomous system prevents this gamification by validating input metrics against quality guardrails and cross-referencing code activity with actual system behavior.
To resolve these bottlenecks, organizations need to automate the goal-tracking lifecycle. This is part of a broader corporate governance transformation, where data accuracy and audit trails are built directly into administrative systems.
2. The Architecture of Autonomous Strategic Alignment
An automated OKR execution engine connects executive strategy directly to the developer toolchain:
  [Executive Objectives] ──> [Department Goals] ──> [Team Key Results]
                                                           ▲
                                                           │ (Automated Updates)
  [Jira Epics / Stories] <─── [Git Commit Logs] <── [Developer Activity]
The system organizes goals into a clear, nested hierarchy:
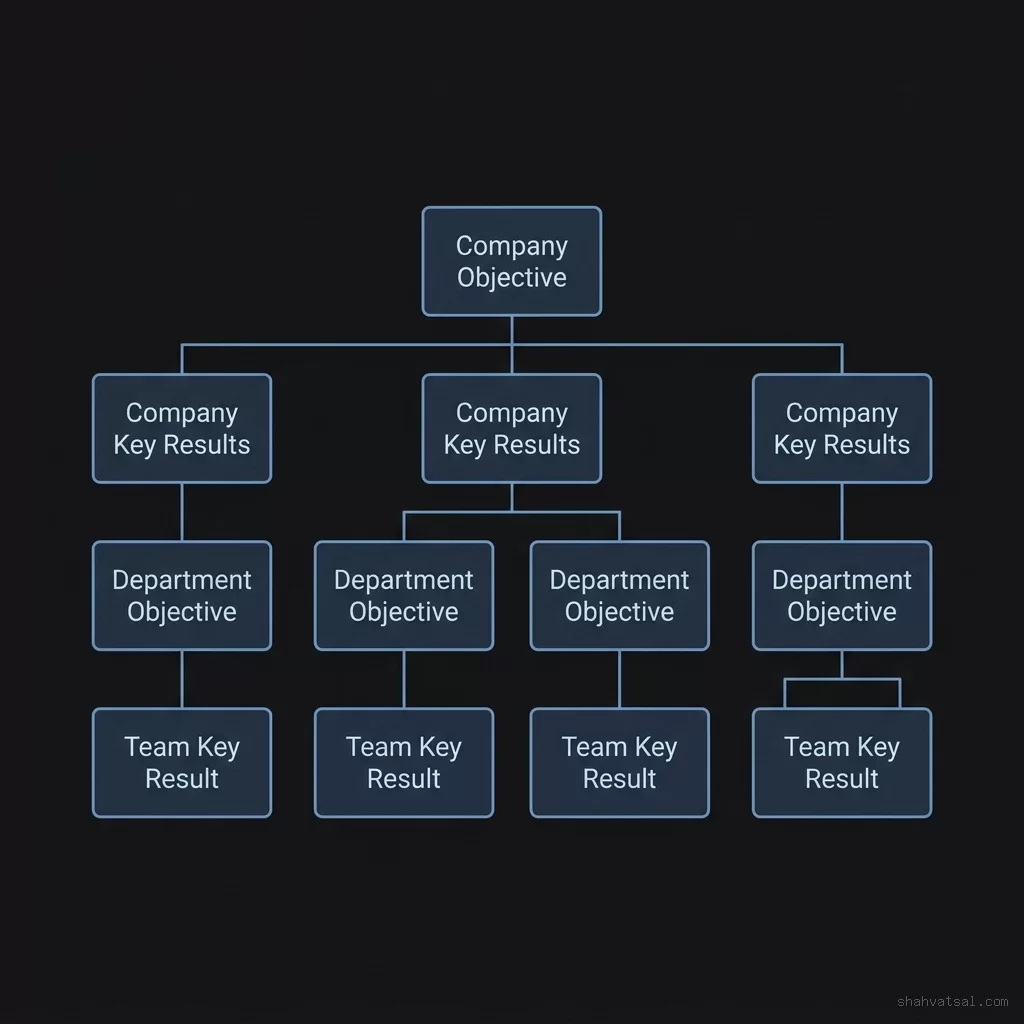
This hierarchy tree ensures that:
- Corporate Objectives represent high-level business goals (e.g., improve system margin efficiency).
- Company Key Results define the metrics used to evaluate success, such as lowering the cloud cost per transaction. (For more details, see our guide on designing a FinOps transformation roadmap).
- Department Objectives inherit these metrics, translating them into specific system targets.
- Team Key Results are directly tied to toolchain metrics (like pull request merge counts, SLA performance, or test coverage).
3. Goal Decomposition: Translating Objectives with Goal Decomposition AI
Strategic goals are often written in ambiguous, human language (e.g., "Improve developer happiness" or "Accelerate delivery speed"). To track them, the engine uses a goal decomposition AI to translate human objectives into structured, quantifiable key results. This process uses semantic parsers and taxonomy models that map qualitative goals to quantitative metrics.
The decomposition workflow proceeds in three phases:
Taxonomy Mapping
The AI parses the raw objective statement using fine-tuned language models. It extracts the semantic intent and matches it against the company's predefined telemetry dictionary. For example, if the objective is "Accelerate delivery speed," the taxonomy mapping engine associates it with metrics likecycle_time, sprint_velocity, and change_failure_rate.
Metric Extraction and Baseline Analysis
The AI connects to historical telemetry data sources (such as Jira task histories and GitHub repository commits from the last 90 days) to establish baseline values. It calculates the statistical mean, standard deviation, and growth trends to recommend realistic, achievable targets. If the baseline cycle time is 8.4 days, the AI might propose a key result of "Reduce cycle time to 6.0 days," ensuring that targets are rooted in real performance data rather than arbitrary management expectations.Dependency Identification
The AI cross-references the proposed objectives with the organization's repository dependency maps and Jira epic links. It analyzes system dependencies to identify potential cross-team bottlenecks before the quarter begins, flagging objectives that are high-risk due to upstream team resource constraints.To illustrate how the decomposition engine represents these relationships, consider the following configuration schema used by the AI tracking agent to define goal mappings:
# Objective Decomposition Blueprint Schema
objective:
  id: "OBJ_ACCEL_DELIVERY_2026"
  raw_title: "Accelerate software delivery velocity across core platforms"
  owner_group: "Platform Engineering"
  decomposition_strategy: "telemetry_aligned"

  key_results:
    - kr_id: "KR_CYCLE_TIME_RED"
      type: "metric"
      source: "jira_sprint_aggregator"
      target_field: "average_cycle_time_days"
      baseline_value: 8.40
      target_value: 6.00
      mathematical_direction: "minimize"
      evaluation_cadence: "weekly"

    - kr_id: "KR_PR_MERGE_RATE"
      type: "metric"
      source: "github_webhook_stream"
      target_field: "weekly_merged_pull_requests"
      baseline_value: 45.0
      target_value: 65.0
      mathematical_direction: "maximize"
      evaluation_cadence: "daily"

    - kr_id: "KR_DEPLOY_STABILITY"
      type: "guardrail"
      source: "deployment_telemetry"
      target_field: "change_failure_rate_percent"
      max_limit_value: 5.0
      current_baseline: 2.3
      mathematical_direction: "minimize"
This structured translation ensures that every key result is linked directly to system telemetry.
4. The Ingestion Pipeline: Parsing Git and Jira Telemetry
To track key results without human updates, the AI OKR tracking agent deploys real-time ingestion pipelines to monitor developer toolchain events:
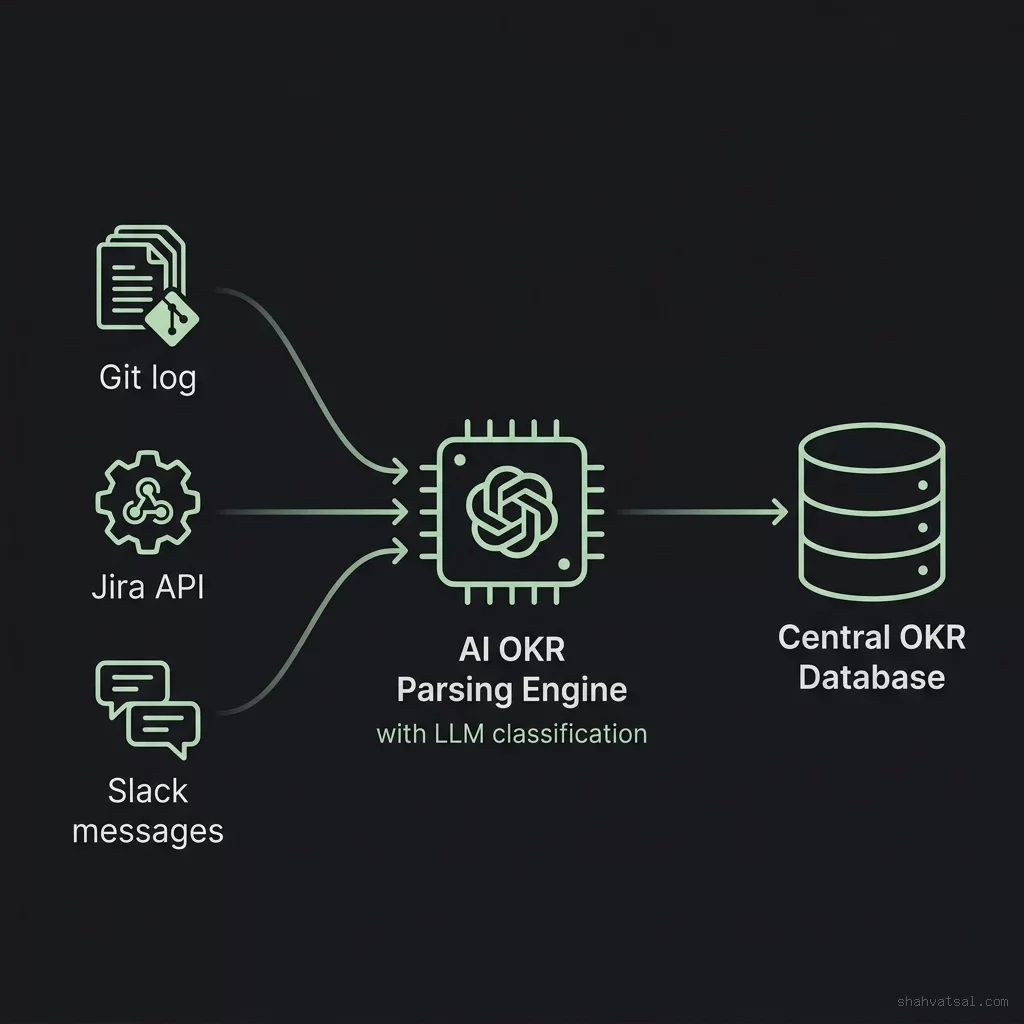
The ingestion layer is built as a series of microservices that consume webhook payloads and poll APIs, converting raw activities into objective performance indicators. The pipeline integrates with three core telemetry systems:
Jira REST API and Webhooks
The agent queries Jira to monitor ticket progress, epic completion rates, and blocker flags. It listens forjira:issue_updated webhook events to capture transitions in ticket state. The system extracts critical metrics like story points completed per sprint, cycle time per issue (calculated as the difference between status transition timestamps from In Progress to Done), and the duration of blocker flags.
Below is an example of the structured JSON payload processed by the agent when a Jira ticket transitions status:
{
  "event": "jira:issue_updated",
  "timestamp": 1776003200000,
  "issue": {
    "key": "PLAT-482",
    "fields": {
      "project": { "key": "PLAT" },
      "summary": "Implement distributed caching layer for user session management",
      "status": { "name": "Done" },
      "customfield_10016": 5.0,
      "resolutiondate": "2026-07-12T14:30:00.000+0000"
    }
  },
  "changelog": {
    "items": [
      {
        "field": "status",
        "fromString": "In Progress",
        "toString": "Done"
      }
    ]
  }
}
Git Webhooks (GitHub / GitLab)
Webhooks stream commit logs, pull request review events, and code diff sizes to the ingestion server. The tracking agent parses these streams to evaluate development velocity and track architectural alignment.Rather than simply counting commits, the agent performs static analysis on the changes:
- It monitors changes in file extensions to track implementation ratios (e.g., verifying if code shifts match front-end or back-end goals).
- It parses merge commit messages to link them back to Jira issue keys using regular expressions (e.g.,
^\[PLAT-\d+\]\s.+). - It monitors pull request cycle times—measuring the time between PR creation, first review, approval, and final merge to identify code review bottlenecks.
Slack / MS Teams Webhooks
The agent monitors team channels for blocker mentions, using Natural Language Processing (NLP) to classify the severity of reported issues. The system runs an autonomous NLP filter that processes incoming chat streams. It extracts key phrases like "blocked on," "waiting for API," or "environment is down" and correlates them with the team's active sprint project.The NLP pipeline uses a sentiment classifier to compute a confidence score. If a blocker sentiment score exceeds a threshold of 0.75, the tracking agent logs a risk entry in the okr_blockers table and initiates the escalation sequence.
This automated telemetry ingestion ensures that key result updates are based on verified code and issue states rather than subjective human assessments.
5. Automated Grading: The Mathematical Logic of OKR Grading AI
At the end of each sprint, the OKR grading AI calculates progress scores using a normalized, mathematical formula. This mathematical framework prevents manual manipulation and provides a standardized baseline for comparing progress across diverse teams.
Progression Models and mathematical functions
We model progress using three distinct mathematical profiles depending on the type of key result being tracked:
1. Linear Metric Progression
For metrics that scale proportionally with effort (such as cloud database cost reduction, unit transaction latency, or code coverage), we calculate a simple bounded linear score.Let:
- $P_t \in [0.0, 1.0]$ be the progress score of a key result at time $t$.
- $V_{\text{current}}$ be the current value of the metric.
- $V_{\text{baseline}}$ be the value of the metric at the start of the quarter.
- $V_{\text{target}}$ be the target value of the metric.
$$P_t = \text{clamp}\left( \frac{V_{\text{current}} - V_{\text{baseline}}}{V_{\text{target}} - V_{\text{baseline}}}, 0.0, 1.0 \right)$$
Where the $\text{clamp}(x, \min, \max)$ function ensures that the progression score remains bounded between $0.0$ and $1.0$, preventing over-achievement in one metric from artificially masking under-achievement in another.
2. Non-Linear Sigmoidal S-Curve Progression
For complex software engineering deliverables (such as shipping a new microservice framework, migrating a legacy database, or releasing an authorization API), progress is non-linear. The initial phases involve research, schema design, and local setup, which produce minimal visible progress. This is followed by a rapid implementation spike, and final testing/compliance gates where progress levels off.To represent this workflow, we model progress using a logistics sigmoid function:
$$P_t = \frac{1}{1 + e^{-k(t - x_0)}}$$
Where:
- $k$ is the acceleration factor, representing the execution velocity of the team (typically configured between $0.5$ and $1.5$).
- $x_0$ is the midpoint of the timeline (typically week 6 of a 12-week tracking cycle).
- $t$ is the current week index ($t \in [1, 12]$).
3. Step-Function and Milestone-Based Progression
For binary outcomes (such as obtaining a security compliance certification or completing a disaster recovery drill), the progress remains $0.0$ until the milestone is completed, at which point it transitions directly to $1.0$.The Goodhart Vulnerability Index (GVI)
To prevent teams from optimizing a target metric at the expense of system quality (e.g., merging low-quality PRs to hit velocity goals), the grading engine calculates a Goodhart Vulnerability Index ($G_{vi}$):$$G_{vi} = 1.0 - \left( \frac{\text{Change Failure Rate}{\text{baseline}}}{\text{Change Failure Rate}{\text{current}}} \times \frac{\text{SLA Compliance}{\text{current}}}{\text{SLA Compliance}{\text{baseline}}} \right)$$
If the $G_{vi}$ score deviates by more than $0.25$, the engine triggers an automatic audit flag, indicating that the target metric is being gamified at the expense of structural quality.
6. Blocker Detection & Escalation: Automated Alerting Loops
Real-time tracking is only useful if it triggers corrective action when key results fall behind. The engine implements an automated blocker detection and escalation flow:

Blocker Identification and Risk Calculation
The engine evaluates key results continuously, flagging them as "At Risk" when their trajectory falls below the expected threshold. The risk level is computed as a composite Risk Score ($R_s$) on a scale of $0.0$ to $10.0$:$$R_s = w_1 \cdot D_r + w_2 \cdot C_o + w_3 \cdot B_d$$
Where:
- $D_r$ is the Delay Ratio, representing the percentage of target timeline remaining vs. the percentage of target metric remaining:
- $C_o$ is the Criticality Index of the objective, ranging from $1.0$ (team goal) to $3.0$ (company-wide goal).
- $B_d$ is the Blocker Duration Index, scaling linearly with the hours a linked Jira ticket has been marked as blocked.
- $w_1, w_2, w_3$ are normalized weights where $\sum w_i = 1.0$ (typically configured as $0.5$, $0.3$, and $0.2$ respectively).
Escalation Path
When the risk score $R_s$ exceeds specific thresholds, the engine executes the following escalation pathway:graph TD
A["Blocker Detected"] --> B["Calculate Risk Score (R_s)"]
B --> C{"Is Risk Score > 7.0?"}
C -- No --> D["Post Slack Alert to Team Owner"]
C -- Yes --> E["Generate Blocker Remediation Proposal"]
E --> F["Escalate to Leadership Pager (Opsgenie/PagerDuty)"]This automated alerting pathway ensures that critical development delays are addressed immediately before they impact delivery timelines.
7. The Quarterly Cadence: Mapping the Automation Cycle
The OKR lifecycle is structured into a recurring quarterly roadmap:
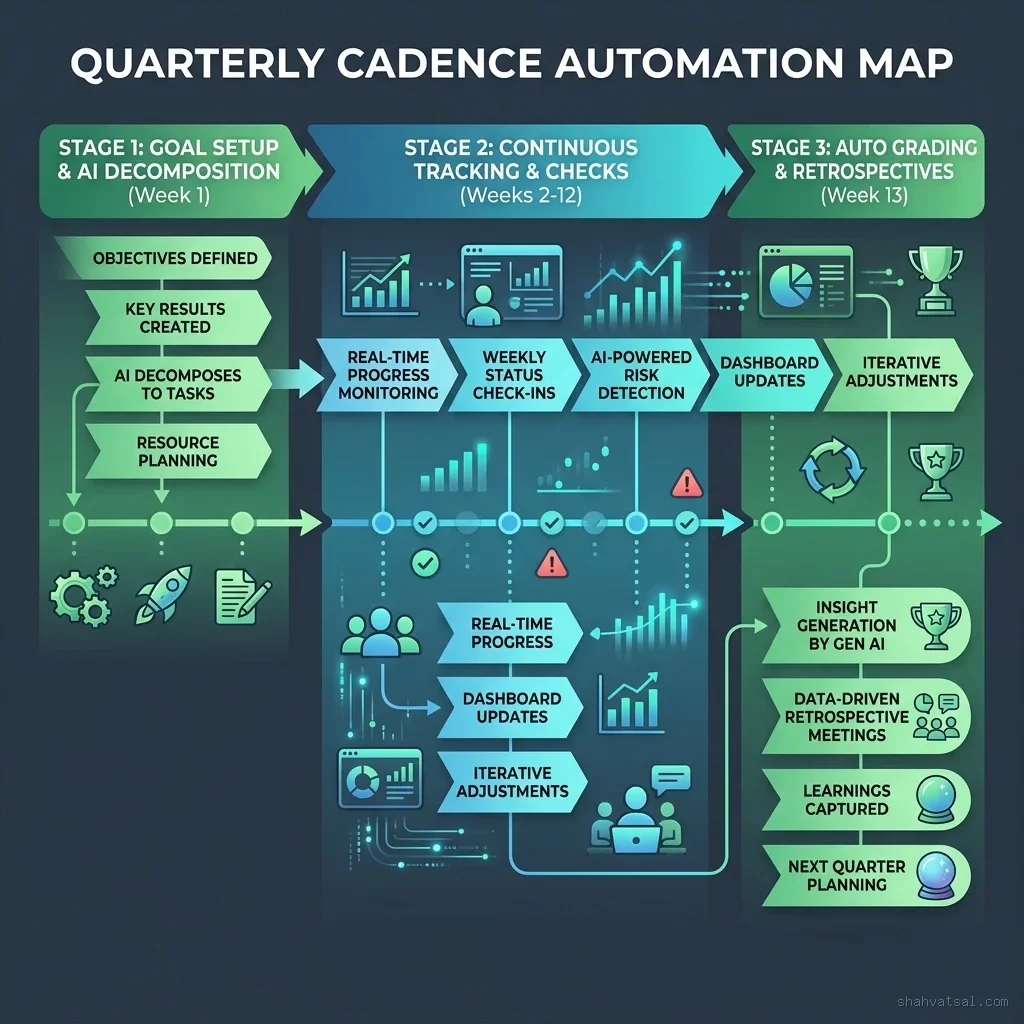
Phase 1: Objective Setup & AI Decomposition (Week 1)
Leadership defines strategic goals. The AI parses the objectives, suggests key results, and maps dependencies across teams.Phase 2: Ingestion & Real-Time Tracking (Weeks 2–12)
The ingestion pipeline streams git commits, Jira tickets, and cost metrics to update key result scores daily. Blocker detection loops run continuously.Phase 3: Automated Grading & Retrospective (Week 13)
The grading engine calculates the final OKR scores, updates the database logs, and compiles retrospective summaries comparing targets against actual performance.8. Database Schema and SQL Aggregation Blueprints
To track the OKR hierarchy, we define the relational PostgreSQL schemas and metric queries below. This schema is designed to scale to thousands of key results across multiple divisions while maintaining strict query performance.
Database Tables (PostgreSQL DDL)
-- 1. Objectives Table (Company, Department, or Team Level)
CREATE TABLE objectives (
    id VARCHAR(50) PRIMARY KEY,
    title VARCHAR(255) NOT NULL,
    owner_id VARCHAR(100) NOT NULL,
    level VARCHAR(20) DEFAULT 'team' CHECK (level IN ('company', 'department', 'team')),
    parent_id VARCHAR(50) REFERENCES objectives(id),
    created_at TIMESTAMP WITH TIME ZONE DEFAULT CURRENT_TIMESTAMP
);

-- Indexing parent hierarchy for rapid tree traversal
CREATE INDEX idx_objectives_parent ON objectives(parent_id);
CREATE INDEX idx_objectives_level ON objectives(level);

-- 2. Key Results Table (Telemetry-Linked Targets)
CREATE TABLE key_results (
    id VARCHAR(50) PRIMARY KEY,
    objective_id VARCHAR(50) REFERENCES objectives(id) ON DELETE CASCADE,
    title VARCHAR(255) NOT NULL,
    metric_source VARCHAR(50) NOT NULL, -- e.g., 'jira', 'github', 'aws_billing'
    baseline_value NUMERIC(12, 4) NOT NULL,
    current_value NUMERIC(12, 4) NOT NULL,
    target_value NUMERIC(12, 4) NOT NULL,
    progression_type VARCHAR(20) DEFAULT 'linear' CHECK (progression_type IN ('linear', 's_curve', 'binary')),
    last_updated_at TIMESTAMP WITH TIME ZONE DEFAULT CURRENT_TIMESTAMP
);

CREATE INDEX idx_key_results_source ON key_results(metric_source);
CREATE INDEX idx_key_results_objective ON key_results(objective_id);

-- 3. Blocker Logs (Risk Detection Audit)
CREATE TABLE okr_blockers (
    id BIGSERIAL PRIMARY KEY,
    key_result_id VARCHAR(50) REFERENCES key_results(id) ON DELETE CASCADE,
    severity_score NUMERIC(3, 1) NOT NULL CHECK (severity_score >= 0.0 AND severity_score <= 10.0),
    description TEXT NOT NULL,
    resolved_at TIMESTAMP WITH TIME ZONE,
    detected_at TIMESTAMP WITH TIME ZONE DEFAULT CURRENT_TIMESTAMP
);

CREATE INDEX idx_okr_blockers_active ON okr_blockers(key_result_id) WHERE resolved_at IS NULL;

-- 4. Ingested Jira Sprint Metrics Cache
CREATE TABLE raw_jira_sprints (
    project_key VARCHAR(10) PRIMARY KEY,
    story_points_completed INT NOT NULL,
    story_points_total INT NOT NULL,
    last_sprint_end TIMESTAMP WITH TIME ZONE
);

-- 5. Historical Progress Snapshots (For Timeline Charts and Drift Analysis)
CREATE TABLE kr_progress_snapshots (
    id BIGSERIAL PRIMARY KEY,
    key_result_id VARCHAR(50) REFERENCES key_results(id) ON DELETE CASCADE,
    recorded_at TIMESTAMP WITH TIME ZONE DEFAULT CURRENT_TIMESTAMP,
    current_value NUMERIC(12, 4) NOT NULL,
    calculated_score NUMERIC(5, 4) NOT NULL
);

CREATE INDEX idx_kr_snapshots_lookup ON kr_progress_snapshots(key_result_id, recorded_at DESC);
SQL Query 1: Calculating Real-Time Key Result Progress
The following query calculates the progress score ($P_t$) for all active key results in the system, handling linear, non-linear, and step-function metric calculations:SELECT
kr.id AS key_result_id,
kr.title AS key_result_title,
kr.current_value,
kr.target_value,
kr.progression_type,
CASE
WHEN kr.progression_type = 'linear' THEN
-- Linear Progression Formula bounded between 0.0 and 1.0
LEAST(GREATEST(
(kr.current_value - kr.baseline_value) /
NULLIF(kr.target_value - kr.baseline_value, 0)
, 0.0), 1.0)
WHEN kr.progression_type = 's_curve' THEN
-- Simplified S-curve Sigmoid logistic estimation
1.0 / (1.0 + EXP(-6.0 * (
(kr.current_value - kr.baseline_value) /
NULLIF(kr.target_value - kr.baseline_value, 0) - 0.5
)))
WHEN kr.progression_type = 'binary' THEN
-- Step function evaluation
CASE WHEN kr.current_value >= kr.target_value THEN 1.0 ELSE 0.0 END
ELSE 0.0
END AS calculated_progress_score,
-- Blocker status indicator
(SELECT COUNT(*) FROM okr_blockers ob WHERE ob.key_result_id = kr.id AND ob.resolved_at IS NULL) > 0 AS is_currently_blocked
FROM key_results kr;SQL Query 2: Cascading Objective Scores
This query uses a Recursive Common Table Expression (CTE) to cascade scores from team-level key results up through department and company objectives:WITH RECURSIVE objective_tree AS (
-- Anchor member: calculate leaf-level objective scores from key results
SELECT
o.id,
o.parent_id,
o.level,
COALESCE(AVG(
CASE
WHEN kr.progression_type = 'linear' THEN
LEAST(GREATEST((kr.current_value - kr.baseline_value) / NULLIF(kr.target_value - kr.baseline_value, 0), 0.0), 1.0)
WHEN kr.progression_type = 's_curve' THEN
1.0 / (1.0 + EXP(-6.0 * ((kr.current_value - kr.baseline_value) / NULLIF(kr.target_value - kr.baseline_value, 0) - 0.5)))
ELSE 0.0
END
), 0.0) AS calculated_score
FROM objectives o
LEFT JOIN key_results kr ON o.id = kr.objective_id
GROUP BY o.id, o.parent_id, o.level
),
recursive_scores AS (
-- Recursive member: aggregate scores from children
SELECT
id,
parent_id,
level,
calculated_score AS score,
1 AS depth
FROM objective_tree
UNION ALL
SELECT
p.id,
p.parent_id,
p.level,
c.score AS score,
c.depth + 1 AS depth
FROM objectives p
INNER JOIN recursive_scores c ON p.id = c.parent_id
)
SELECT
id,
level,
ROUND(AVG(score)::NUMERIC, 3) AS consolidated_alignment_score
FROM recursive_scores
GROUP BY id, level
ORDER BY level DESC, consolidated_alignment_score DESC;9. What to Do Monday Morning: 3 Steps to Configure an Automated Check-In Script
To transition your team away from manual status updates and implement real-time OKR tracking, execute these three steps:
Step 1: Draft the Objective and Key Result Schemas
Map your company, department, and team objectives into the PostgreSQL tables outlined in this guide. Link each key result to a specific database metric source.Step 2: Establish the Jira and Git Ingestion Pipelines
Write serverless tasks to pull completed story points and git commit logs from your toolchain APIs.Step 3: Run the Automated Check-In Pipeline
Write a Python script to calculate progress scores and cache the updates to your dashboard daily.A basic Python check-in script is shown below:
import psycopg2
from datetime import datetime

def run_automated_okr_checkin(db_url):
    """Aggregates toolchain telemetry metrics and updates key result values in PostgreSQL."""
    conn = psycopg2.connect(db_url)
    cursor = conn.cursor()

    # 1. Update Jira-linked Key Results from Sprint Cache
    jira_query = """
        UPDATE key_results kr
        SET current_value = (
            SELECT COALESCE(rjs.story_points_completed::NUMERIC / NULLIF(rjs.story_points_total, 0) * 100.0, 0.0)
            FROM raw_jira_sprints rjs
            WHERE rjs.project_key = SUBSTRING(kr.id FROM 1 FOR 3)
        ),
        last_updated_at = NOW()
        WHERE kr.metric_source = 'jira';
    """

    # 2. Update Cloud Billing-linked Key Results from FinOps tables
    billing_query = """
        UPDATE key_results kr
        SET current_value = (
            SELECT COALESCE(SUM(cost), 0.0)
            FROM raw_cloud_billing
            WHERE recorded_date >= DATE_TRUNC('month', NOW())
        ),
        last_updated_at = NOW()
        WHERE kr.metric_source = 'aws_billing';
    """

    print("Executing automated OKR check-in pipeline...")
    cursor.execute(jira_query)
    cursor.execute(billing_query)
    conn.commit()
    cursor.close()
    conn.close()
    print("OKR progress values updated successfully.")
10. Frequently Asked Questions
How does this engine prevent political bias in OKR reviews?
By sourcing progress metrics directly from development toolchains (e.g., Jira velocity, Git commits, cloud billing) rather than manual manager updates, the engine anchors progress in objective execution telemetry. It eliminates the standard end-of-quarter negotiation where teams advocate for partial grades based on qualitative efforts. Because the ingestion layer tracks actual output changes, deployment frequencies, and cost parameters, the metrics represent a single source of truth that is fully auditable. Managers can still provide qualitative comments or override grades with reason codes, but the base telemetry remains immutable, preventing teams from padding or sandbagging performance scores.Can the engine support non-linear key results?
Yes. While linear progress is calculated as a simple percentage of target completion, non-linear key results (like feature releases or database migrations) use an S-curve logistic function to estimate progress. The S-curve logistic function ($P_t = 1 / (1 + e^{-k(t - x_0)})$) accounts for the typical project lifecycle where progress starts slowly during design/setup, accelerates during implementation, and slows down during validation. This ensures teams are not flagged as "off track" during initial phases where tangible deliverables are still being structured.How does the blocker detection system evaluate risk?
The system flags risk when it detects a drop in sprint velocity, a dependency hold in Jira exceeding 48 hours, or high frustration sentiment scores in team chat channels. It calculates a composite Risk Score ($R_s$) combining the Delay Ratio (remaining timeline vs. remaining target progress), the Criticality Index of the objective (company-wide goals have higher weights), and the Blocker Duration Index. When the score crosses predefined thresholds, the engine escalates notifications to Slack channels or raises a high-priority incident on PagerDuty.What is the role of goal decomposition AI in this framework?
The AI translates human-written, strategic objectives into structured, telemetry-linked key results. It parses the semantic intent of objective statements and matches them against a company-wide metrics taxonomy dictionary. The engine then reviews historical telemetry logs from Git and Jira to establish statistical baselines (mean, variance, and trend), recommending realistic target bounds. Finally, it reviews cross-repository dependency graphs to flag potential scheduling conflicts across teams before execution begins.How often should OKR progress scores be updated?
The ingestion pipeline runs continuously, updating key result values daily. While webhook events stream git commits and Jira state transitions in real-time, progress recalculation is typically aggregated on a daily cadence to avoid dashboard noise. Blocker detection loops, however, evaluate risk scores hourly to ensure that critical delays are escalated immediately. This combination provides leadership with real-time risk visibility without overloading developers with volatile day-to-day progress fluctuations.What is the difference between a North Star Metric and an OKR?
The North Star Metric is a long-term, structural representation of customer value and product strategy. OKRs are temporary, quarterly targets designed to focus team efforts on moving specific variables within that North Star tree. (For more details, see our guide on designing a North Star Metric tree).Does the system support human overrides for automated grades?
Yes. While the engine calculates scores programmatically, managers can input manual override weights or explanations to account for qualitative context not captured by telemetry.How are cross-team dependencies tracked?
The engine analyzes Jira project boards to identify linked tickets. If a team's key result depends on a ticket assigned to another squad, the system monitors that dependency and flags risks if it is delayed.Can the system integrate with Slack or Microsoft Teams?
Yes. The tracking agent post real-time updates and blocker alerts directly to team channels, prompting owners to resolve issues before they escalate.What open-source libraries are used to calculate the S-curve estimations?
The S-curve progression is calculated using basic Python math packages (such as NumPy or SciPy) and executed as a standard database trigger query.How are sensitive developer metrics protected under GDPR?
The ingestion engine pseudonymizes individual developer IDs, aggregating commits and cycle times at the team level to prevent individual tracking.What is the Goodhart Vulnerability Index in OKR design?
It is a statistical measure that monitors the relationship between input metrics and quality guardrails. If a team optimizes a key result while quality drops, the index flags potential metric gamification.How are financial key results linked to cloud spend?
The engine extracts actual cloud infrastructure costs per transaction from your provider's billing tables and compares them against target unit cost key results.What happens if a key result is missing a baseline telemetry value?
The system runs a baseline analysis on historical data from the previous 30 days to calculate a starting value before the tracking quarter begins.How does the escalation system prioritize pager alerts?
Alerts are prioritized by calculating a composite risk score based on the severity of the blocker, the target deadline, and the importance of the company objective.11. Conclusion
The shift from manual, subjective OKR tracking to an automated, AI-driven execution engine is a major step forward in operational efficiency. By connecting strategic objectives directly to engineering telemetry, resolving resource bottlenecks programmatically, and enforcing counter-metric guardrails, tech organizations can align their daily activities with their highest-value corporate goals.
Start by cataloging your objectives, building basic Jira and Git ingestion pipelines, and establishing a baseline scoring model. The improvements in alignment and execution velocity will immediately validate the investment.