STRATEGIC OVERVIEW Every product manager claims to have a North Star. Every product manager claims to have a North Star. In boardrooms, slide decks, and quarter…
Every product manager claims to have a North Star. In boardrooms, slide decks, and quarterly alignment meetings, leaders point to a singular, high-level number—like Daily Active Users (DAU), Monthly Transacting Customers, or Gross Merchandise Value (GMV)—and declare it the operational center of their product strategy.
Yet, when you ask the engineering team or product leads to name the three direct, actionable input metrics that actually move that North Star, you are usually met with silence or a list of disconnected vanity indicators.
In the competitive technology landscape of 2026, relying on a singular lagging metric is a severe operational risk. If a product's primary metric begins to decline, a lagging dashboard cannot explain why it is declining, nor can it guide product squads toward a concrete solution. Leading organizations are replacing simple dashboards with a comprehensive North Star Metric Tree—a mathematical model that links day-to-day engineering output and feature releases directly to long-term business value.
This shift represents a fundamental realignment of how engineering and product teams collaborate. Historically, software teams were measured on output—the number of features shipped, sprint velocity, or story points completed. However, shipping features does not guarantee customer value. An input-centric framework bridges this gap by translating engineering output into behavioral changes among users. Developers are no longer just writing code; they are actively optimizing specific variables in the product's value formula, such as reducing onboarding friction to drive new user activation.
This guide provides a detailed blueprint for product managers, software architects, and growth engineers to design, implement, and audit a quantitative North Star Metric framework. We will explore metric tree formulations, input-to-NSM causal mapping, counter-metric guardrail systems, database DDLs, and automated SQL queries. We will show how to translate abstract strategic concepts into concrete database telemetry, enabling your teams to build a product compass that points directly toward sustainable business growth.

1. The Digital Compass: Why Vanity Dashboards Fail
Traditional product analytics rely on passive dashboards. Teams accumulate charts tracking sign-ups, page views, and button clicks, resulting in a cluttered data catalog. These metric collections suffer from three major structural flaws:
The Vanity Metric Delusion
Vanity metrics are numbers that look good on paper but do not correlate with long-term retention or customer lifetime value. For example, a sudden spike in registrations driven by an expensive ad campaign is a vanity indicator if 90% of those new users churn within 24 hours. Focusing on these metrics diverts engineering attention away from core product usability.Metric Latency and Lack of Actionability
High-level financial and engagement metrics—such as Monthly Active Users (MAU) or Annual Recurring Revenue (ARR)—are lagging indicators. By the time a drop in ARR shows up on an executive dashboard, the user experience issues that caused the churn occurred months earlier. These metrics are not actionable for developer teams because they cannot be directly influenced by single feature releases.Lack of Structural Context
A list of 50 unrelated charts does not provide a coherent view of product health. If signups increase but feature adoption declines, is the product succeeding or failing? Without a defined framework linking these inputs, teams lack a shared understanding of success.To address these challenges, product organizations need a structured framework that organizes metrics logically, showing how developer outputs feed into customer value and business revenue.
2. The Amplitude Playbook: Deconstructing the North Star Metric Framework
The Amplitude North Star Playbook defines the North Star Metric as the key measure of the relationship between the customer problems that the product team aims to solve and the long-term revenue goals of the business.
A valid product north star definition must fulfill three distinct criteria:
- Measure Customer Value: It must capture the core utility that users derive from the product. If users do not find value, they will not retain, and the product will fail.
- Represent Product Strategy: It must reflect the unique value proposition of the product. Two companies in the same industry can have entirely different North Star Metrics depending on their strategic focus.
- Predict Lagging Revenue: It must act as a leading indicator of long-term business performance (such as expansion revenue, subscription renewals, or transaction fees).
[Product Vision] -> [Customer Value (NSM)] -> [Business Outcome (Revenue)]According to the Amplitude framework, a North Star Metric is composed of three structural dimensions:
- Breadth (Reach): How many active users are performing the core action within the product? (e.g., Weekly Active Users).
- Depth (Action): What level of value are they getting? (e.g., Number of queries executed per user session).
- Frequency (Transmission): How often do they return to perform the action? (e.g., Number of active days per week).
3. Amplitude Game Categorization: Transaction, Attention, or Productivity
The Amplitude playbook introduces the concept of the Product Game. Before a team can choose their North Star Metric, they must identify which of the three primary product games they are playing:
                  +--------------------------------+
                  |     The Product Game Match     |
                  +--------------------------------+
                  /               |                \
                 /                |                 \
  [Attention Game]        [Transaction Game]      [Productivity Game]
   Maximize Time           Maximize Transactions   Maximize Task Efficiency
1. The Attention Game
- Objective: Maximize the amount of time users spend interacting with the product.
- Business Model: Typically ad-supported or content subscription models.
- Examples: Netflix, YouTube, Medium, social networks.
- North Star Metric Focus: Total time spent viewing content, content engagement depth.
2. The Transaction Game
- Objective: Help users find, select, and purchase goods or services efficiently.
- Business Model: E-commerce, marketplaces, and transaction fee platforms.
- Examples: Amazon, Uber, Stripe, Airbnb.
- North Star Metric Focus: Number of successful bookings, total checkout value, order completion rate.
3. The Productivity Game
- Objective: Help users complete their business or personal tasks with maximum efficiency and minimum friction.
- Business Model: Software-as-a-Service (SaaS) and utility subscriptions.
- Examples: Slack, Jira, Zoom, Excel.
- North Star Metric Focus: Weekly active collaborative teams, number of completed tasks per user.
4. The Mathematical Formulation: Constructing the Metric Tree
Rather than viewing the North Star Metric as a single number, we model it as a mathematical tree. The top-level metric is computed as a function of its underlying input variables:
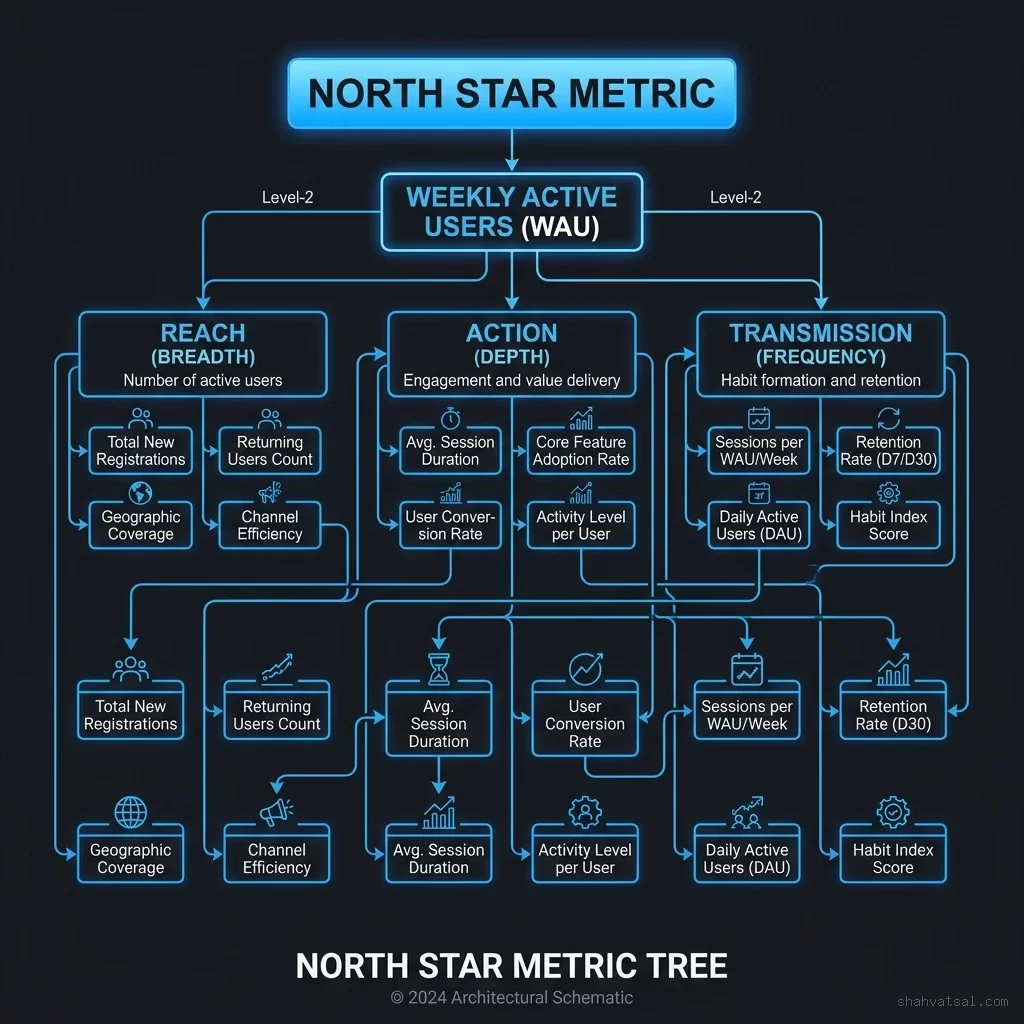
Let:
- $N$ be the value of the North Star Metric for a given time period.
- $R$ be the Reach variable (number of unique active accounts).
- $D$ be the Depth variable (average transaction volume or usage depth per active account).
- $F$ be the Frequency variable (average number of interactions per active account).
$$N = R \times D \times F$$
Expanding the Inputs
Each primary dimension is further decomposed into leading inputs. For a B2B SaaS platform (such as an automated project capital allocation system), the variables can be defined as:1. Reach ($R$)
The active user footprint:- $R_{\text{new}}$: Newly activated accounts in the current cohort.
- $R_{\text{retained}}$: Existing accounts that returned in the current cohort.
- $R_{\text{resurrected}}$: Dormant accounts that re-engaged.
2. Depth ($D$)
The level of value delivered per session:- $D_u$: Number of active features used per session.
- $D_v$: Volume of transactions or operations executed.
Where $A$ is the set of active accounts, and $w_1, w_2$ are weight factors representing the strategic value of each action.
3. Frequency ($F$)
The recurrence rate:- $F_d$: Average active days per user per week.
- $F_s$: Average sessions per active day.
This mathematical breakdown ensures that any change in the top-level North Star Metric can be traced to a specific variable, pinpointing the exact driver of performance shifts.
5. Input Metrics as Leading Indicators vs. Lagging Indicators
Understanding the difference between leading and lagging indicators is a core component of metric design:
| Characteristic | Input Metrics (Leading) | Output Metrics (Lagging) |
|---|---|---|
| Measurement Target | Day-to-day user behaviors and feature usage. | High-level business outcomes. |
| Response Latency | Near real-time (daily or weekly loops). | Delayed (monthly, quarterly, or annual). |
| Actionability | High; directly tied to engineering releases. | Low; hard to change directly without inputs. |
| Examples | Code commits, query executions, search clicks. | Annual Recurring Revenue (ARR), Churn Rate, NPS. |
6. Causal Mapping: Modeling Leading Inputs to Lagging Outcomes
To prove that our input metrics are valid leading indicators of the North Star, we construct an Input-to-NSM Causal Map:
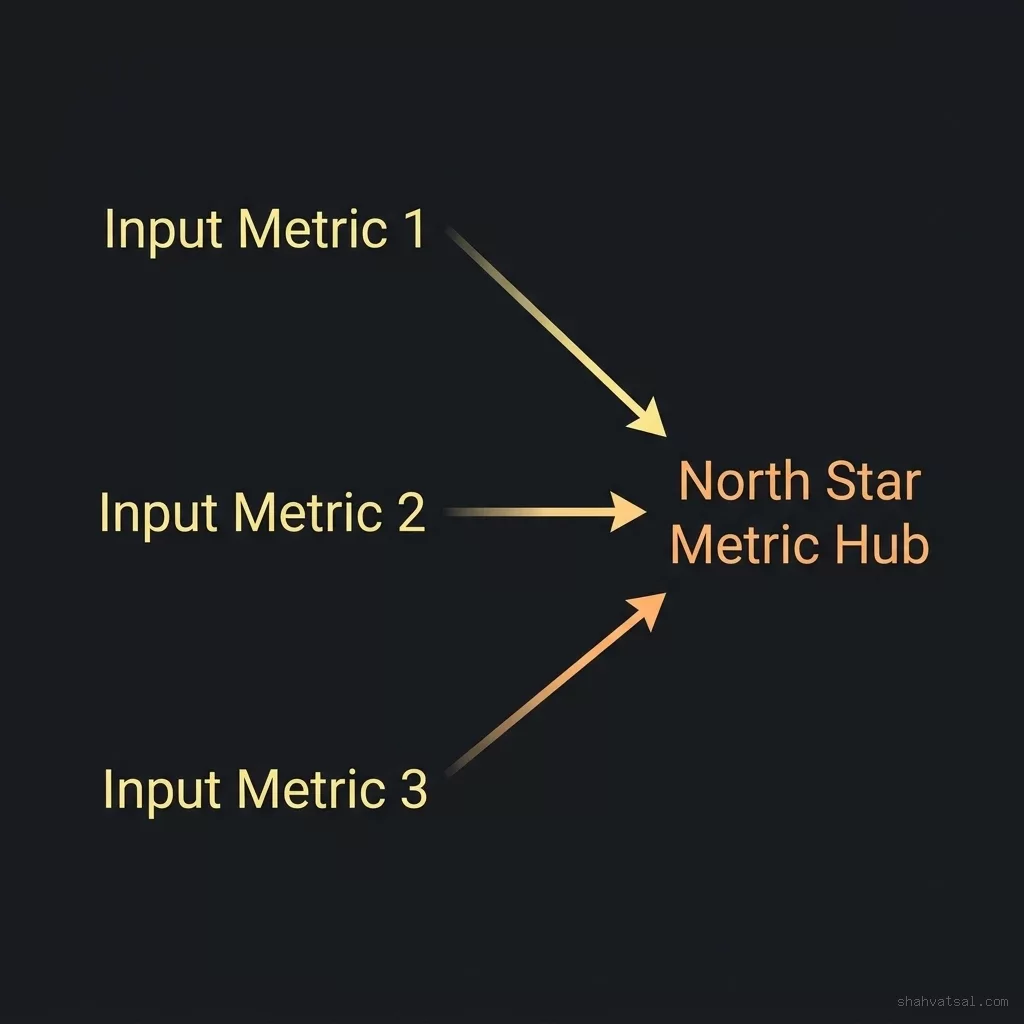
We define a causal feedback loop showing how day-to-day actions impact long-term business performance:
  [Developer Code Change]
            │
            ▼
  [Input Metric: Feature Adoption Rate] ──> [Leading Indicator: Session Depth]
                                                        │
                                                        ▼
  [Business Outcome: ARR Retention] <── [North Star Metric: Weekly Value Delivered]
Validating the Causal Relationship
We use statistical correlation to validate these causal assumptions. For example, if we hypothesize that "setting up a query guard" ($I_1$) leads to increased account retention ($N$), we calculate the Pearson correlation coefficient ($r$) across historical cohorts:$$r = \frac{\sum (I_{1, t} - \bar{I}1)(N{t} - \bar{N})}{\sqrt{\sum (I_{1, t} - \bar{I}1)^2 \sum (N{t} - \bar{N})^2}}$$
An input is verified as a valid leading indicator only if it shows a strong positive correlation ($r > 0.70$) with the North Star Metric in subsequent cohorts, accounting for lag time.
This analytical process is similar to how organizations link development activities to cloud spend optimization, a core concept in our guide on FinOps transformation roadmap design.
7. Counter-Metric Guardrails: Defeating Goodhart's Law
"When a measure becomes a target, it ceases to be a good measure." This principle, known as Goodhart's Law, is a major challenge in metric design. If a team is incentivized solely to maximize a single metric, they will optimize for it at the expense of other critical areas.
Real-World Failure Modes
- Optimizing Sign-ups: A growth team focuses entirely on maximizing registrations. They implement dark patterns that trick users into signing up, causing a spike in registrations followed by a massive wave of immediate churn and brand damage.
- Optimizing Session Duration: An engagement team updates the interface to increase time spent in-app. They achieve this by making navigation confusing, forcing users to click through multiple pages to find basic settings. Session duration increases, but user frustration spikes, leading to long-term retention drops.
The Guardrail System
To prevent these distortions, every North Star Metric must be paired with counter-metric guardrails: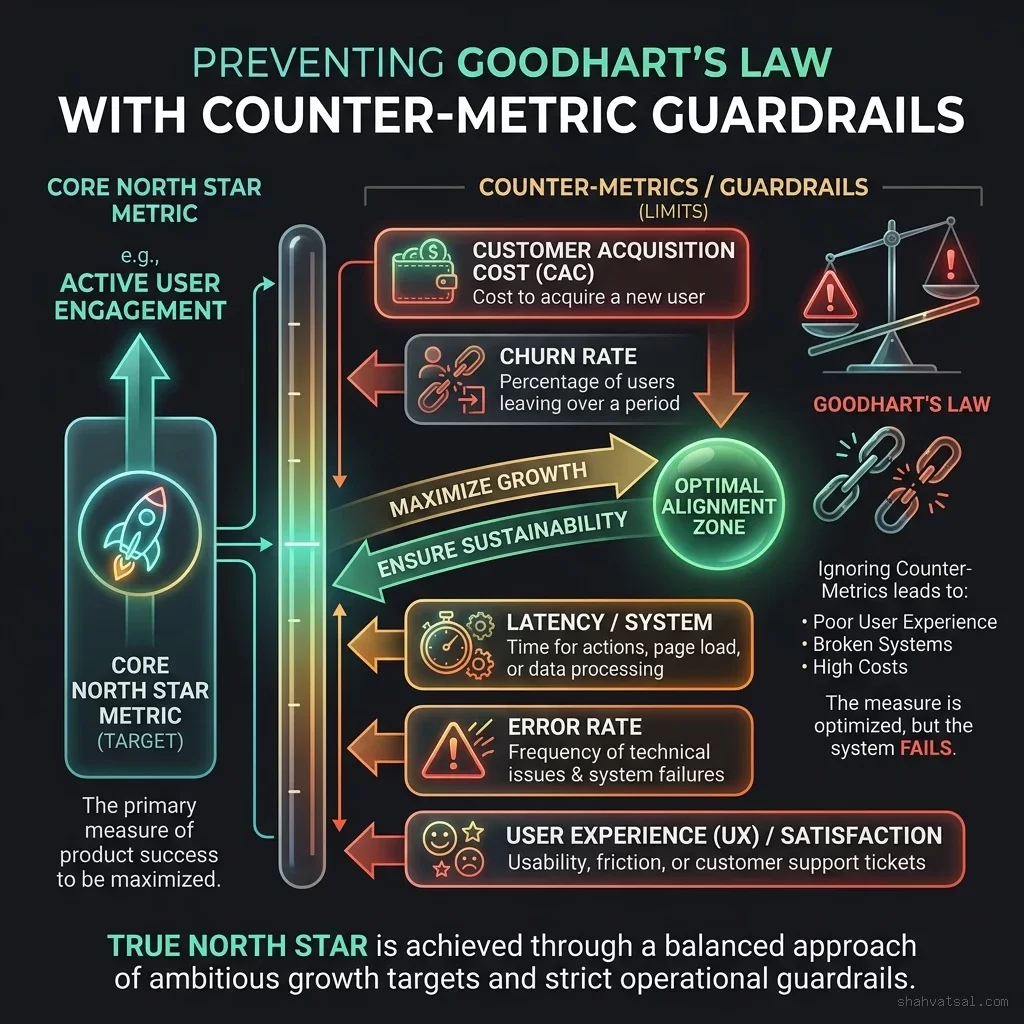
We define three key guardrails:
- Quality / Error Rate Guardrail ($Q$): Ensures that usage volume is not driven by system bugs or retries. If API call count increases because 30% of requests are returning 500 errors, the metric is invalid.
- Financial Cost Guardrail ($C$): Enforces cost constraints. If user engagement is driven by features that run expensive GPU inference tasks without a clear monetization path, the growth model is unsustainable.
- User Trust / Privacy Guardrail ($T$): Monitored through consent Opt-Out rates and privacy policy rejections, ensuring growth respects user boundaries.
8. The Mathematics of Goodhart's Law: The Vulnerability Index
To detect when a metric has been target-optimized at the expense of product value, we calculate the Goodhart Vulnerability Index ($V_g$). This index measures the divergence between the normalized value of the input metric ($I$) and the associated guardrail value ($Q$):
$$V_g = \left| \frac{\Delta I_t}{\Delta Q_t} \right| \times \sigma^2(Q)$$
Where:
- $\Delta I_t$ is the rate of change of the input metric over time period $t$.
- $\Delta Q_t$ is the rate of change of the quality or retention guardrail.
- $\sigma^2(Q)$ is the historical variance of the guardrail.
9. Case Study: Comparing Three Different Product Game Models
To show how the metric tree is tailored to different business models, we outline three case study scenarios below:
| Dimension | B2B SaaS (Productivity Game) | B2C Media (Attention Game) | E-commerce (Transaction Game) |
|---|---|---|---|
| Core North Star | Weekly Active Collaborating Teams | Weekly Hours of Content Watched | Weekly Completed Orders |
| Reach (Input 1) | Number of active business accounts | Weekly active viewers | Number of active shoppers |
| Depth (Input 2) | Average files shared per team | Average videos watched per user | Average items per cart |
| Frequency (Input 3) | Average active days per user | Average active sessions per day | Average sessions per week |
| Quality Guardrail | p99 API response latency | Video playback buffer rate | Order return rate |
| Financial Guardrail | Server hosting cost per account | CDN bandwidth cost per GB | Customer acquisition cost (CAC) |
10. The Strategic Alignment: North Star Metric vs. OKRs
A common point of confusion is how the North Star Metric framework fits alongside Objectives and Key Results (OKRs). The two frameworks are not mutually exclusive; they are complementary systems:
  [North Star Metric Tree] (Immutable Model of Product Strategy)
            │
            ▼
  [Quarterly OKRs] (Temporary Targets to Move Specific Tree Variables)
The Difference in Focus
- North Star Metric: A long-term, structural representation of how your product creates and delivers value. The metric and its input variables rarely change unless the company undergoes a major pivot.
- OKRs: Short-term, tactical targets (typically quarterly) set to focus team efforts. OKRs define what goals the team will pursue to move specific variables in the North Star Metric tree.
- Objective: Accelerate onboarding completion for new B2B users.
- Key Result 1: Improve the day-1 setup success rate from 45% to 75%.
- Key Result 2: Reduce the average setup cycle time from 15 minutes to under 5 minutes.
11. Database Schema and SQL Aggregation Blueprints
To track the metric tree, we require a scalable database schema to collect and aggregate user interactions.
Database Tables (PostgreSQL DDL)
-- 1. Accounts Registry
CREATE TABLE accounts (
    id VARCHAR(50) PRIMARY KEY,
    company_name VARCHAR(255) NOT NULL,
    plan_tier VARCHAR(50) DEFAULT 'free',
    activated_at TIMESTAMP WITH TIME ZONE DEFAULT CURRENT_TIMESTAMP
);

-- 2. User Interactions Log
CREATE TABLE user_interactions (
    id BIGSERIAL PRIMARY KEY,
    account_id VARCHAR(50) REFERENCES accounts(id) ON DELETE CASCADE,
    user_id VARCHAR(50) NOT NULL,
    interaction_type VARCHAR(50) NOT NULL, -- e.g., 'query_executed', 'dashboard_shared'
    payload_size_kb INT DEFAULT 0,
    recorded_at TIMESTAMP WITH TIME ZONE DEFAULT CURRENT_TIMESTAMP
);

-- 3. System Errors Guardrail Log
CREATE TABLE system_performance_logs (
    id BIGSERIAL PRIMARY KEY,
    account_id VARCHAR(50) REFERENCES accounts(id) ON DELETE CASCADE,
    endpoint VARCHAR(255) NOT NULL,
    response_code INT NOT NULL, -- e.g., 200, 500
    latency_ms INT NOT NULL,
    recorded_at TIMESTAMP WITH TIME ZONE DEFAULT CURRENT_TIMESTAMP
);

-- 4. Metric Scorecard Snapshot Cache
CREATE TABLE nsm_snapshots (
    cohort_week DATE PRIMARY KEY,
    reach_score INT NOT NULL,
    depth_score NUMERIC(8, 2) NOT NULL,
    frequency_score NUMERIC(8, 2) NOT NULL,
    composite_nsm NUMERIC(12, 2) NOT NULL,
    error_rate_guardrail NUMERIC(4, 2) NOT NULL,
    generated_at TIMESTAMP WITH TIME ZONE DEFAULT CURRENT_TIMESTAMP
);
SQL Query: Weekly North Star Tree Aggregation
The following query calculates the weekly components of the North Star Metric ($Reach \times Depth \times Frequency$) and checks the error rate guardrail:WITH cohort_time AS (
SELECT DATE_TRUNC('week', NOW() - INTERVAL '1 week') AS target_week
),
weekly_active_accounts AS (
SELECT
account_id,
COUNT(id) AS interaction_count,
COUNT(DISTINCT DATE_TRUNC('day', recorded_at)) AS active_days
FROM user_interactions, cohort_time
WHERE recorded_at >= target_week AND recorded_at < target_week + INTERVAL '7 days'
GROUP BY account_id
),
weekly_errors AS (
SELECT
COUNT(id) AS total_requests,
SUM(CASE WHEN response_code >= 500 THEN 1 ELSE 0 END) AS error_count
FROM system_performance_logs, cohort_time
WHERE recorded_at >= target_week AND recorded_at < target_week + INTERVAL '7 days'
)
SELECT
target_week AS cohort_week,
-- 1. Reach: Count of unique active accounts
COUNT(wa.account_id) AS reach_score,
-- 2. Depth: Average interaction count per active account
AVG(wa.interaction_count) AS depth_score,
-- 3. Frequency: Average active days per week per account
AVG(wa.active_days) AS frequency_score,
-- 4. Composite North Star Metric (R * D * F)
(COUNT(wa.account_id) * AVG(wa.interaction_count) * AVG(wa.active_days)) AS composite_nsm,
-- 5. Error Guardrail: Percentage of server errors
COALESCE(we.error_count::NUMERIC / NULLIF(we.total_requests, 0) * 100.0, 0.0) AS error_rate_guardrail
FROM weekly_active_accounts wa
CROSS JOIN cohort_time
CROSS JOIN weekly_errors we
GROUP BY target_week, we.error_count, we.total_requests;12. Team-to-Metric Mapping and Operational Ownership
A North Star Metric is only effective if individual product squads own specific inputs. If everyone is responsible for the overall North Star, then no one is responsible for the day-to-day actions needed to move it.
We implement a Team-to-Metric Mapping matrix:
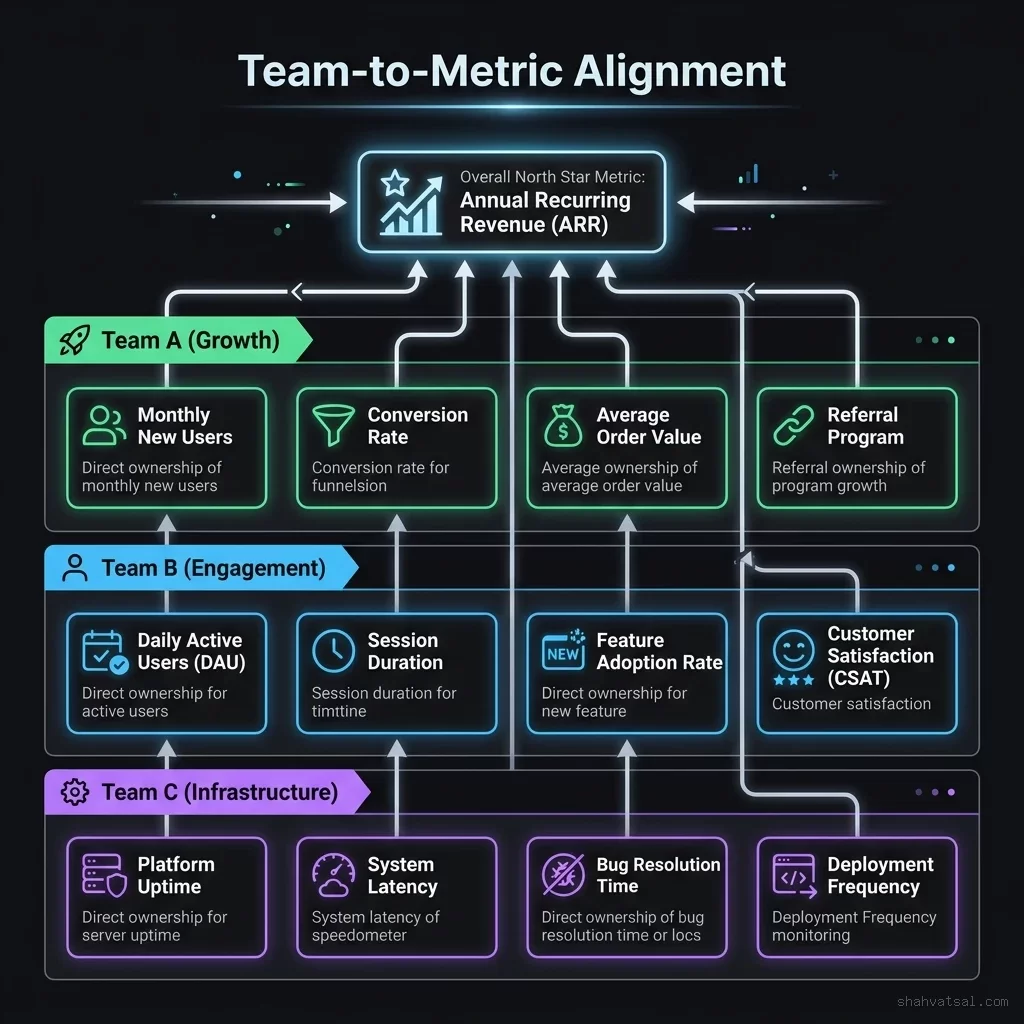
Structure of Ownership
Growth Squad
- Focus: Reach Variable ($R$)
- Core Input Metrics: Day-1 signup conversion rate, user onboarding setup success, email click-through rates.
- Operational Goal: Increase the volume of new active accounts entering the ecosystem.
Engagement Squad
- Focus: Depth Variable ($D$)
- Core Input Metrics: Average queries run per session, dashboard share rate, collaborative document edits.
- Operational Goal: Encourage users to explore advanced features and establish deep product habits.
Platform Infrastructure Squad
- Focus: Guardrails ($Q$ and $C$)
- Core Input Metrics: p99 database latency, API availability rate, hosting cost per active user session.
- Operational Goal: Maintain system stability, keep infrastructure costs aligned, and prevent Goodhart's Law distortions.
13. The Evolution Roadmap: Sizing the Metric as the Product Matures
A common mistake is assuming that a product's North Star Metric remains static forever. As a product matures through different stages of its lifecycle, its core strategic goals shift:
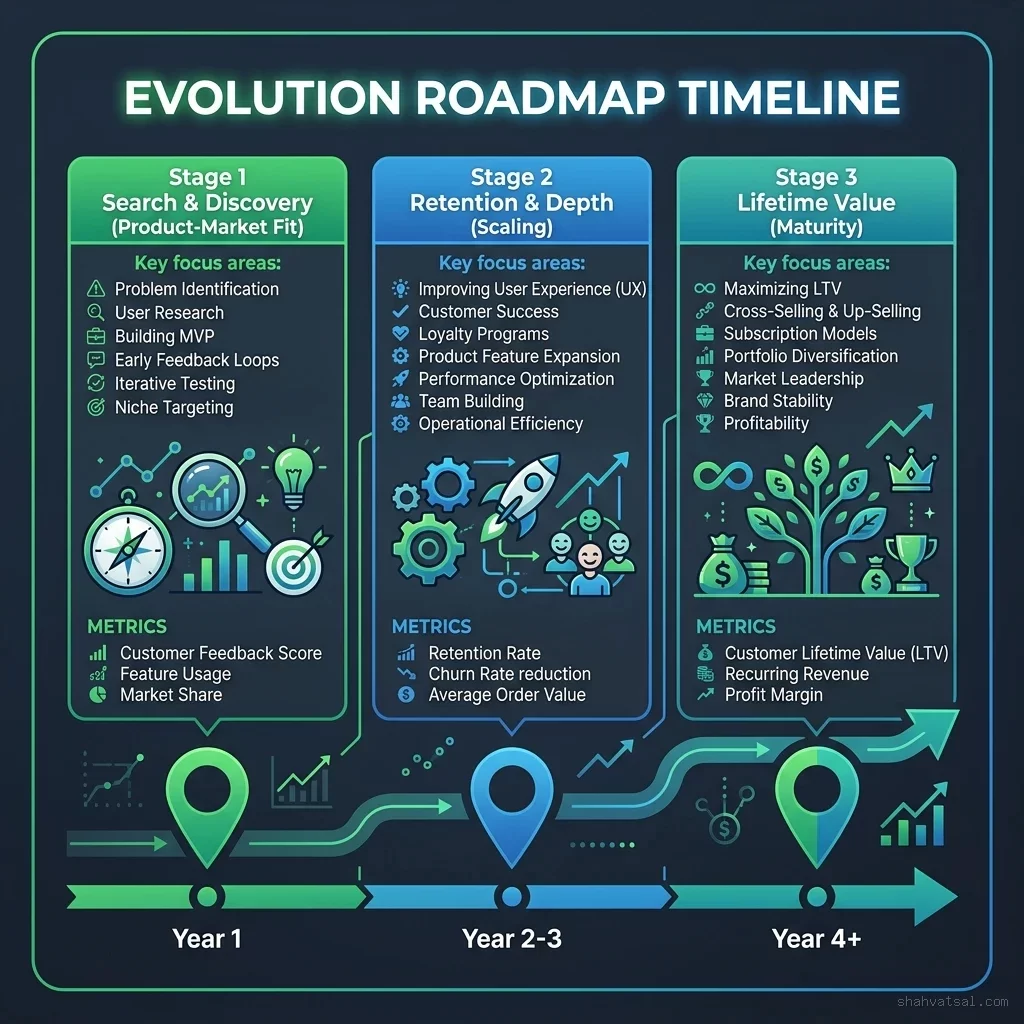
Stage 1: Product-Market Fit (Launch Phase)
- Strategic Focus: Discovery and value validation.
- Example Metric: Retained Active Users (proving that users who sign up find enough value to return).
- Core Variable: Frequency (verifying the product is building long-term habits).
Stage 2: Monetization & Expansion (Scaling Phase)
- Strategic Focus: Efficiency and scalable revenue growth.
- Example Metric: Volume of paid transactions or collaborative sharing loops.
- Core Variable: Depth (driving expansion value across accounts).
Stage 3: Ecosystem Maturity (Optimization Phase)
- Strategic Focus: Churn prevention and operating efficiency.
- Example Metric: Gross margin per user session or ecosystem integration density.
- Core Variable: Guardrails (controlling costs and optimizing system performance).
14. What to Do Monday Morning: 3 Steps to Implement a Local Metric Scorecard
To begin transitioning your product from vanity dashboards to a structured North Star framework, execute these three steps:
Step 1: Draft the Metric Tree
Gather your product and engineering leads for a workshop. Define a single, customer-centric North Star Metric, and map its three primary inputs (Reach, Depth, Frequency) as variables in a visual tree.Step 2: Establish the Database Logging Schema
Create the logging tables for user interactions and system errors, using the PostgreSQL DDL schema provided in this guide.Step 3: Schedule the Aggregation Pipeline
Write a serverless task or cron job to run the weekly metric aggregation SQL query. Output the scores to a dashboard so the team has clear visibility into the health of the input metrics.Below is an example of an aggregation script in Python:
import psycopg2
from datetime import datetime

def run_weekly_metric_aggregation(db_url):
    """Calculates weekly metric tree components and inserts snapshots into cache."""
    conn = psycopg2.connect(db_url)
    cursor = conn.cursor()

    # Query to calculate and cache weekly metrics
    query = """
        INSERT INTO nsm_snapshots (cohort_week, reach_score, depth_score, frequency_score, composite_nsm, error_rate_guardrail)
        WITH cohort_time AS (
            SELECT DATE_TRUNC('week', NOW() - INTERVAL '1 week') AS target_week
        ),
        weekly_active AS (
            SELECT account_id, COUNT(id) AS interactions, COUNT(DISTINCT DATE_TRUNC('day', recorded_at)) AS days
            FROM user_interactions, cohort_time
            WHERE recorded_at >= target_week AND recorded_at < target_week + INTERVAL '7 days'
            GROUP BY account_id
        ),
        weekly_errs AS (
            SELECT COUNT(id) AS total, SUM(CASE WHEN response_code >= 500 THEN 1 ELSE 0 END) AS errors
            FROM system_performance_logs, cohort_time
            WHERE recorded_at >= target_week AND recorded_at < target_week + INTERVAL '7 days'
        )
        SELECT
            target_week,
            COUNT(wa.account_id),
            COALESCE(AVG(wa.interactions), 0.0),
            COALESCE(AVG(wa.days), 0.0),
            (COUNT(wa.account_id) * COALESCE(AVG(wa.interactions), 0.0) * COALESCE(AVG(wa.days), 0.0)),
            COALESCE(we.errors::NUMERIC / NULLIF(we.total, 0) * 100.0, 0.0)
        FROM weekly_active wa
        CROSS JOIN cohort_time
        CROSS JOIN weekly_errs we
        GROUP BY target_week, we.errors, we.total
        ON CONFLICT (cohort_week) DO UPDATE SET
            reach_score = EXCLUDED.reach_score,
            depth_score = EXCLUDED.depth_score,
            frequency_score = EXCLUDED.frequency_score,
            composite_nsm = EXCLUDED.composite_nsm,
            error_rate_guardrail = EXCLUDED.error_rate_guardrail;
    """

    print("Executing weekly metric aggregation pipeline...")
    cursor.execute(query)
    conn.commit()
    cursor.close()
    conn.close()
    print("Scorecard snapshot updated successfully.")
15. Frequently Asked Questions
How does the North Star Metric prevent political bias in product decisions?
By grounding success in objective, telemetry-driven user behavior rather than self-reported surveys or slide pitches, the metric tree provides a single source of truth for the entire organization.What is Goodhart's Law in the context of product management?
Goodhart's Law states that when a metric is set as a target, teams will optimize for it at the expense of system quality, leading to negative side-effects (such as user frustration or high infrastructure costs).What is the difference between leading and lagging indicators?
Leading indicators measure near-term actions that predict future success, while lagging indicators measure past results (like revenue or churn) that are difficult to change directly.Can a product have more than one North Star Metric?
We strongly recommend choosing a single North Star Metric to maintain organizational focus. However, different product lines or distinct business units can maintain separate sub-trees that roll up to a shared business outcome.How often should a North Star Metric be changed?
The metric should remain stable as long as the core product strategy remains the same. If the business shifts its focus (e.g., pivoting from rapid growth to margin optimization), the metric tree should be updated to reflect the new direction.What is the core recommendation of the Amplitude North Star Playbook?
The playbook recommends defining the North Star Metric as the intersection of customer value, product strategy, and business revenue, and structuring it along three dimensions: Reach, Depth, and Frequency.How do counter-metrics act as system guardrails?
Counter-metrics monitor dimensions like error rates, system latency, and cloud costs. If these metrics exceed predefined thresholds, the system flags the issues, preventing teams from optimizing for engagement at the expense of system stability.Does the metric tree support predictive forecasting?
Yes. By performing correlation analysis on historical inputs and outcomes, teams can build predictive models to forecast future business metrics based on current user behavior trends.How do OKRs align with the North Star Metric?
OKRs set quarterly, tactical targets to move specific variables in the long-term North Star tree, ensuring that temporary team goals serve a clear strategic purpose.What is the role of growth engineers in this framework?
Growth engineers instrument the event tracking systems, construct database schemas, and build the automated pipelines needed to calculate and report metric scores.How does de-identification work in analytics database queries?
The query pipeline strips direct identifiers (like names or emails) from event payloads before writing to the analytics database, ensuring patient and user privacy.How are input metric weights ($w_1, w_2$) determined?
Weights are determined by running regression models on historical user data to identify which actions have the highest correlation with long-term retention.What is the Product Game in Amplitude framework?
It is a classification system identifying whether a product competes on Attention (maximizing time), Transaction (maximizing purchases), or Productivity (maximizing task efficiency).What is the Goodhart Vulnerability Index?
It is a statistical measure tracking the divergence rate between a core input metric and its associated quality guardrail to detect artificial metric gamification.How do B2C media products define their North Star Metric?
B2C media products usually play the Attention Game, selecting a North Star based on total content hours watched or average sessions per week to predict subscription retention.16. Conclusion
The transition from vanity dashboards to a structured, mathematical North Star Metric tree is a major milestone in product development. By standardizing project evaluations, establishing clear leading inputs, and defining counter-metric guardrails, engineering and product teams can work in alignment to drive customer value and business revenue.
Start by mapping your product's metric tree, setting up secure event-logging schemas, and establishing weekly aggregation pipelines. The gains in team focus and product velocity will immediately validate the investment.